
The Tug of War: Team FED / Treasury (Bulls) vs. COVID-19 (Bears)
The road map for the next stock market move is getting complicated and uncertain. Complicated, because most of the short-term trends are bullish, while most of the mid to long term trends are still bearish, with the intervention of the FED and Treasury (TSY) fighting economic gravity. They are doing everything possible to support the economy and financial markets. In the past it has been hard or even unwise to fight the FED. Uncertain, because no one really knows what the new economic environment will look like when we emerge from this pandemic or how social distancing will affect daily economic activity. This uncertainty is the root cause of the current indecision in the stock market. Financial markets do not build uptrends on uncertainty but again, the FED and TSY are fighting economic gravity.
In our last Market Comment on March 27th, we analyzed the S&P500 Index rebound, which was only a few days old and what to expect from it. Back then the index closed at 2584.59 and we said that the index needed to close above 2644 for the uptrend to resume and the fight between bulls and bears to take place between 2650 and 2793. And here we are: last week from April 20th through April 25th the S&P500 moved between 2727 and 2869.
The question is where does the stock market go from here? Our short term indicators are bullish, with a handful of strong uptrends, but mid to long term indicators are bearish. Consider that usually when short term trends continue to improve, mid and long term trends also improve, eventually turning bullish throughout time. The opposite is true in bear markets. Whether or not this will be the case now, remains to be seen.
Part of the problem is that the handful of strong uptrends taking place are in U.S. Treasuries, gold, gold miners and biotechnology, the latter for obvious reasons. This is hardly representative of a bull market willing to take on risk. Additionally, the volatility index (VIX) although far from its peak at 80’s is still far from reaching bearish levels (usually below low 20’s), which would be bullish for stocks. Since March 23rd the stock market has been rallying on lower volume (see chart below) and unchanged volatility. I’m using the word unchanged because VIX remains high. This is called “head-fake” because it sucks investors into the rally due to fear of missing out (FOMO) and then the market collapses. Typical bear market rally.
Credit spreads are lower than their peak in late March, but not where they were before the crisis regardless of FED intervention and their buying of corporate bonds, even BBB and high yield.
The fundamentals of the U.S. and the world economy are navigating uncharted waters with uncertain perspectives. Therefore, objectively determining the next trend of the stock market may provide guidance in terms of how much risk a portfolio may or may not take. In order to determine the next leg we are going to use the same repetitive analysis we used in the past to avoid every single bear market since the internet bubble.
We have nine indicators for short, mid and long term trends and three more for confirmation. Out of nine, two short term indicators are positive and bullish, seven remain negative and bearish and the three we look at for confirmation are negative too.
In the S&P500 chart below, the green rectangle defines the area where the index can move if the uptrend continues, regardless of lower volume and unchanged volatility. Price is the leading indicator and it will do whatever it wants to do, regardless of volume and volatility. If the S&P500 gets to the green area, we must see at least five of the nine trend indicators positive and bullish for the uptrend to be sustainable.
If the S&P500 never makes it to the green shaded area and instead rolls over, the first support area becomes 2745 (blue shaded area). If 2745 area does not hold, the next support area becomes 2650 to 2500 (pink shaded area).
With the information we have at the time of this writing, we do not believe the S&P500 will go back to test the lows of March (2191). Although anything and everything is possible, the question is if it is likely to happen. Unless COVID-19 gets out of control, with Team FED / TSY pulling together from one end of the rope, we do not believe a test of the March lows is likely. Could it happen? Yes. Is it likely to happen? Probably not (key word: probably).
We shall keep monitoring our indicators for trend confirmation, whether bullish or bearish. In the meantime keep in mind that the S&P500 Index, can swing in either direction due to heavy intervention and lots of uncertainties. Short term, we remain cautiously bullish.
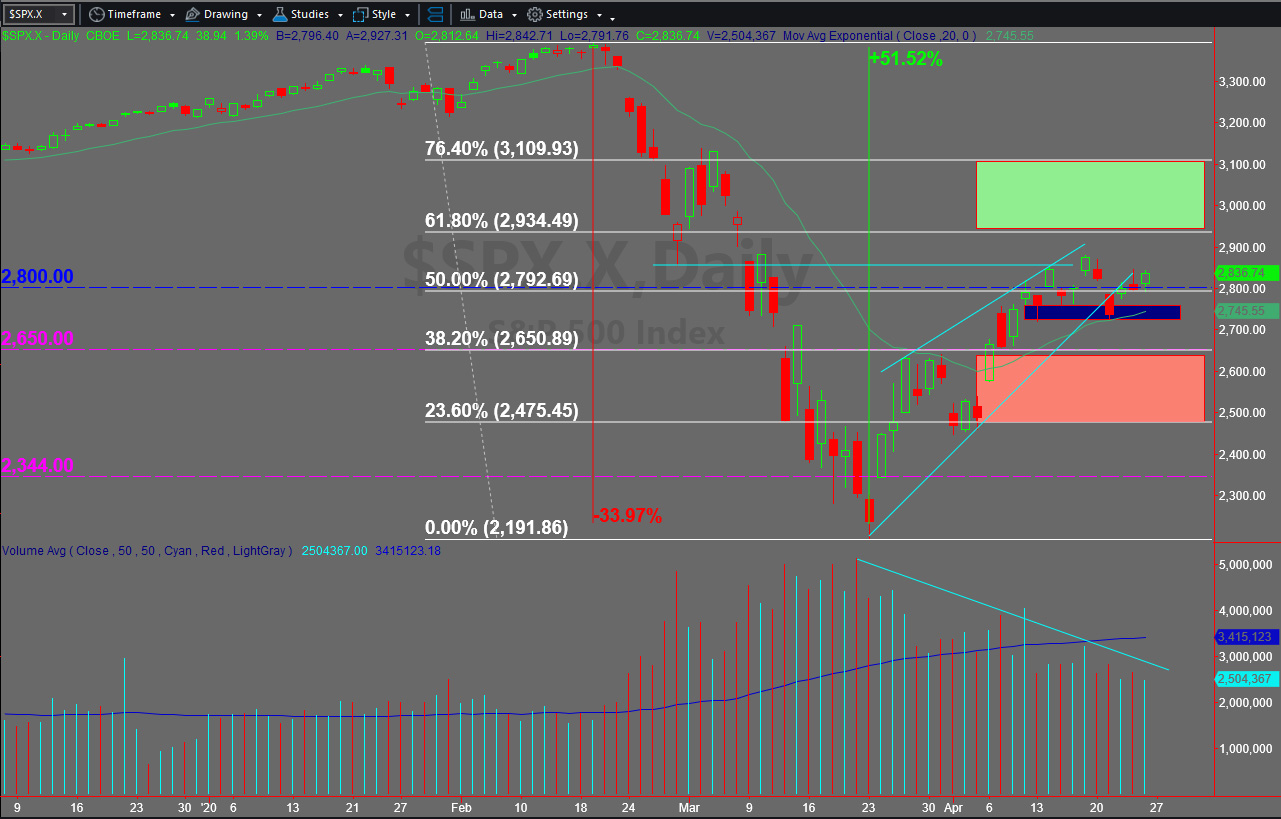
Chart provided by TradeStation


