Introduction to Our Investment Process:

Read our white paper below to learn about the roots of our proprietary investment process. We discuss the Efficient Market Hypothesis, the importance of growth and inflation, and the role of monetary policy among other topics. If you’re curious to learn more, be sure to review our Works Cited!

“The worldwide market crash of autumn 2008 had many causes: greedy bankers, lax regulators, and gullible investors to name a few. But there is also a less obvious cause: our all-too-limited understanding of how markets work, how prices move and how risks evolve.”

The (Mis)Behavior of Markets, a Fractal View of Financial Turbulence, Benoit Mandelbrot and Richard L. Hudson (pg. xi).

I cite Mandelbrot, a mathematician and creator of fractal geometry (pg. xxii), because after many years of being somewhat shy about our effective and proprietary process of analyzing financial markets and investments, being told by “experts” that what we do is not possible, I found a PhD in mathematics who argues otherwise. Mandelbrot published a book and many peer reviewed papers supporting the concept on which we ground our analytical process, that market behavior is not linear and almost never rational. Although algorithms, extremely popular today, can be a great tool during times of linear, rational market behavior, volatility and irrational investor psychology create a problem for many investors using algorithms, which will not necessarily adapt to new forms of market behavior. Needless to say, this may be a potential hazard for retail, unsophisticated investors with no risk management strategy in place. The market can move in unpredictable clusters of volatility; therefore, adequately studying how the market behaved in the past can help us determine what may happen in the days to come.

Our process starts by assuming that financial markets are neither linear nor rational, despite old school theories arguing otherwise. In his book, Perry Kaufman explains why the Efficient Market Hypothesis, that markets reach equilibrium, is incorrect, given that markets often over- or underreact, especially in times of high market volatility (Kaufman, 624). In their book, Mandelbrot / Hudson discuss standard financial models, explaining the flawed assumptions at their core. According to the authors, standard financial models used in the industry focus on so-called typical market behavior, characterized by modest price changes, real or seeming trends, and a risky but, nonetheless, “manageable” world (pg. xvii).

Furthermore, in October 2017, Richard Thaler won the Nobel Prize in economics. According to his research, investors, even when they come together in large markets, exhibit the same kind of limited cognition, lack of self-control, and social preferences that consumers do—and therefore systematic inefficiencies can persist in markets without being arbitraged away. In other words, since people could be systematically wrong, markets could be systematically wrong as well (Lewis, pg. 284). Moreover, Thaler’s research on the “Endowment Effect” explains that investors are typically reluctant to sell stocks that had decreased in value (Lewis, pg. 283). In its strongest forms, the “efficient markets hypothesis” has been put into serious question by Thaler’s work, while bringing the emotional aspects of investing to the forefront. According to Montier, investors collect evidence in a biased fashion, constructing a story to justify the evidence, which then is used to reach a final decision (Montier, Ch.15). Therefore, investors are prone to many biases in the decision-making process and thus, real-world behavior is often completely irrational.

Financial turbulence is not rare, but rather at the heart of our markets. Although it cannot be avoided, we must certainly learn how to mitigate it. Mitigating losses has been my mission since my near complete avoidance of the Internet Bubble in 2002-2003. Although it gets much more complicated than this, for now let’s say I achieved this by observing the behavior of and relationship between price, volume and volatility. All three were headed to irrational levels never before seen by me and many others, ultimately creating a largely “unmanageable” world. At that point, I realized that everything I had read and studied on asset management, namely diversification, before the giant selloff that took place back then, was useless. Instead, I realized that the relationship between price, volume and volatility was key to effectively understand and analyze nonlinear and non-rational markets and securities (Kaufman).

Price Volume Volatility | Greenwich Creek Capital

Problematic Facts

In addition to the use of flawed market assumptions, investors and professionals in the industry have failed to evolve with the use of technology. Mandelbrot argues: “We urge change. Financial economics, as a discipline, is where chemistry was in the sixteenth century: a messy compendium of proven knowhow, misty folk wisdom, unexamined assumptions, and grandiose speculation” (pg. xix). I would add, grandiose speculation with other people’s money!

The inability of professionals to evolve in portfolio management, lead them to widely use the “Buy and Hold” strategy as the most efficient way of managing portfolios of financial assets. The charts and commentary below demonstrate that the “Buy and Hold” method applied to a position or a portfolio of positions should not be a reasonable option for any investor. Nonetheless, to this day, “Buy and Hold” is the norm in the industry.

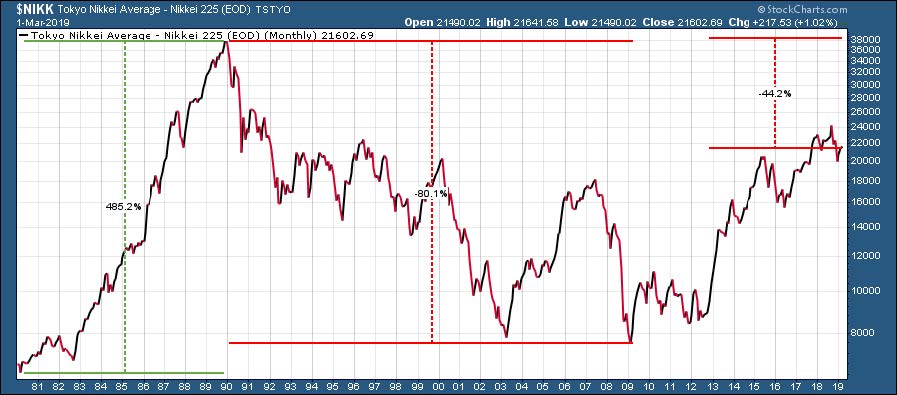
1- The Tokyo Nikkei Average reached 38,915.80 on January 2, 1990, which represented a gain of approx. 485% since 1981. From its 1990 peak, it dropped to 6,994.90 in October 2008. The downtrend lasted for 19 years at a loss of approx. -80%. On March 1, 2019, 29 years later, the Nikkei closed at 21,602.69 still down over -44% from its peak in 1990.

The Tokyo Nikkei Average

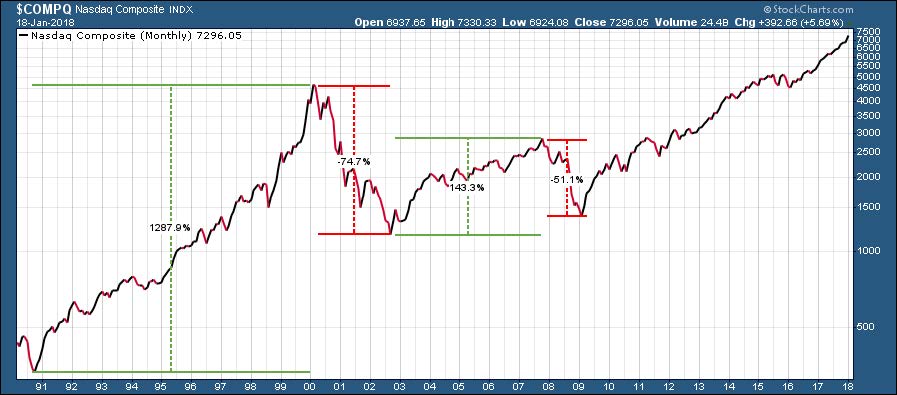
2- The Nasdaq Composite gained approx. over 1200% since Feb 1991 to March 2000, then lost -74.70% of its value to Oct 2002. It took 17 years and a substantial amount of volatility for the Nasdaq to regain its value and break above its previous high in the year 2000.

The Nasdaq Composite

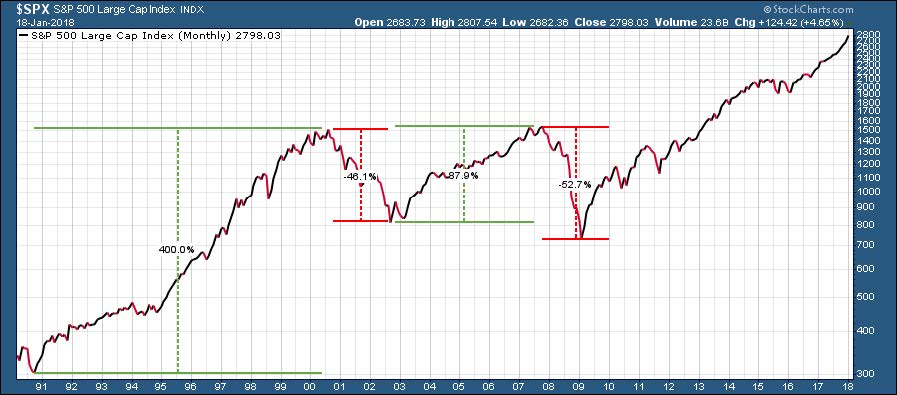
3- The S&P500 Index rose approx. 400% since early 1991 to March 2000. From there to Oct 2002 it lost -46%. Then the index gained approx. 87.9% from Oct 2002 to Oct 2007. And then again lost -52.7% from Oct 2007 to March 2009. It took over 13 years for the S&P500 to regain its year 2000 level.

The S&P500 Index

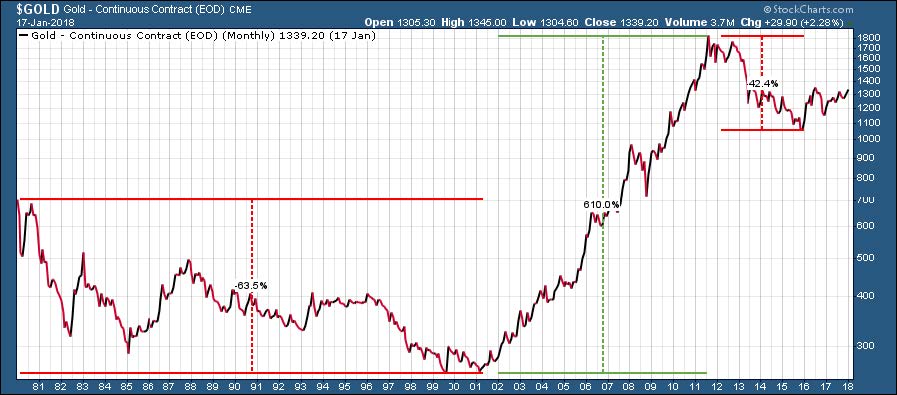
4- Gold reached $873 in January 1980 when the metal started a 20 year downtrend reaching $253.60 in August 1999 and generating a loss of approx. -64%. In January 2008, gold broke above $900 taking over 27 years to recover.

Gold

5- The same can be said for many other indexes and securities including MSFT. It took 16.5 years for the stock to recover from the Internet Bubble.

6- It is important to note that the examples cited above are world-class markets and securities, all highly liquid. Nonetheless, managing and investing in these or any market can be extremely challenging.

Solution

In an ever-more complex world, Mandelbrot argues: “Scientists need both tools, images as well as numbers, the geometric view as well as the analytic view. The two should work together. Visual geometry is like an experienced doctor’s savviness in reading a patient’s complexion, charts and x-rays. Precise analysis is like the medical test results of raw numbers of blood pressure and chemistry. A good doctor looks at both, the pictures and the numbers. Science needs to work that way too.” (pg. xxvi).

There are two methods to analyze markets and financial investments: Fundamental and Technical Analysis. The former is the analysis of data (the numbers) and the latter is the analysis of the charts (visual geometry). Most portfolio and fund managers use only one method, discarding the other. Our process includes a very methodic use of both forms of analysis where price, volume and volatility are of utmost importance.

All of the potential highs, lows, and sentiments associated with investing can overshadow the ultimate goal—making and protecting money. The purpose of designing and adopting a systematic and quantitative approach is precisely to reduce outside emotional effects, allowing the system to operate independently (Kirkpatrick, Ch. 23). That is why it is so important to find a balance between the math involved in making investment decisions and the subjective component of non-linear, inefficient and ever changing market behavior. Our portfolio management style and trading decisions are neither 100% systematic nor 100% discretional, but a balanced combination of both.

It is proven that asset allocation alone, traditionally based on correlations, is not enough to protect portfolios from volatility for a very simple reason: correlations do not always remain the same and when financial markets collapse, most assets do the same. Therefore, the main source of return and protection in a portfolio or fund is the selection of the Portfolio Manager. It is not the access to the information itself, but how the information is processed by the Portfolio Manager that makes the difference.

The Importance of Growth, Inflation & Monetary Policy

Within the context of analyzing financial investments and the main factors affecting their value, the intention of this section is to convey the basic concept of what drives economic growth. I briefly discuss the consequences of inflation and the variables that influence the Federal Reserve’s monetary policy. After all, the main drivers of asset prices are economic growth, inflation and monetary policy.

Anyone interested in investing in financial markets must first understand the economic cycle and its directional path. The future trend of the economy and inflation will influence the Federal Reserve’s monetary policy in changing interest rates. The Federal Reserve Bank uses monetary policy to fluctuate interest rates to control inflation and economic growth expectations.

According to Bob Prince, Co-CIO of Bridgewater Associates.

(a) Asset classes outperform cash over time: When an investment is made in exchange for cash, the exchange carries a risk. Thus the investment has to yield a compensation, called risk premium, surpassing what you would make by keeping your money in cash. The more risk you take, the more premium you require.

(b) Asset prices discount future economic scenarios: “The price of any asset reflects the discounted value of the asset’s future cash flows. These expected cash flows, as well as the discount rate, incorporate expectations about the future economic environment, such as the level of inflation, earnings growth, the probability of default, etc. As the environment and expectations change, the pricing of assets will change. For example: if inflation rises, expectations of the value of money tomorrow change, and this change in conditions will be priced into the value of assets today.” (Prince)

“Given these two structural elements of pricing, the return of any asset will have two main drivers: the accrual of and changes in the risk premium, and unanticipated shifts in the economic environment. The goal of strategic asset allocation becomes clearer: it is to collect the risk premium as consistently as possible, by minimizing risk due to unexpected changes in the economic environment.” (Prince)

“While asset prices incorporate expectations about a wide range of economic factors, growth and inflation are the most important. This is because the aggregate cash flows of an asset class and the rate at which they are discounted are determined largely by the volume of economic activity (growth) and the pricing of that activity (inflation). As a result, asset class returns will be largely determined by whether growth comes in higher or lower than discounted and whether inflation comes in higher or lower than discounted, and how discounted growth and inflation change. The relationships of asset performance to growth and inflation are reliable, indeed, timeless and universal, and knowable, rooted in the durations and sources of variability of assets’ cash flow.” (Prince)

Growing & Protecting Capital

Protecting capital by mitigating or avoiding downtrends is our main objective. We have been successful at doing so since the Internet Bubble by implementing a strong blend between Macro, Technical and Fundamental Analyses to reduce portfolio volatility, while managing market risk by understanding cyclical and secular market trends, as well as Intra-Market relationships. If you do it right, the benefit is to act defensively when necessary and aggressively when appropriate. Portfolio management should not be about “buy and hold” and outperforming the benchmark. This is a big misconception. It should be about achieving reasonable risk/reward performance in bull markets and avoiding the loss of capital in bear markets. Most portfolio managers cannot beat the benchmark consistently and if they are invested one hundred percent of the time–Buy and Hold implemented through a traditional asset allocation distribution—they cannot avoid the loss of capital either. What is the real and professional value-added, then, of a portfolio manager who can neither consistently outperform nor protect capital?

Avoiding downtrends and protecting capital is at the core of our proprietary analytical process, which can be effectively done with the use of technology, software and the many analytical tools available to investors and portfolio managers. It took over 15 years of tests and many books, some useful and others useless, to build our proprietary process. It took not only the testing of many tools, but the testing of our own psychology, while trading and investing.

Results

While providing an efficient quantitative approach to market analysis and a human factor capable of double checking the “quant” approach at all times to mitigate the loss of capital, Greenwich Creek Capital Management, LLC, has successfully managed the Bear Markets of 2001 – 2003; 2008 – 2009; autumn 2011, winter 2015 – 2016; autumn 2018; the 2020 Corona Virus crisis and the 2022 Bear Market, while timely capturing the Bull Markets that ensued.

Conclusion

Every Bear Market we have analyzed started with an economic slowdown, including the Internet Bubble, widely blamed on high valuations in technology. Perhaps valuations were high, but the main catalyst was a slowing economy. The real economy and financial markets are highly correlated (Murphy, pgs. 97-99). Usually, the stock market peaks six to nine months ahead of the economy. The recessions of 1970, 1974, 1980, 1982, 1990 and 2000 were all preceded by inverted yield curves. In a normal yield curve, long term rates are higher than short term rates. When the Federal Reserve tightens monetary policy to fight inflation, it raises short term rates (Murphy, pgs. 97-99). The risk for the real economy and financial markets is when short term rates move above long term rates. This is precisely what happened in 2000. While the inverted yield curve develops, the stocks that become more vulnerable are those showing high price / earnings ratios. Back then, those overvalued stocks happened to be in the dotcom world, including internet and technology, basically the NASDAQ. Additionally, all intermarket trends, good and bad, were visible and giving a clear sign that not only the stock market was in trouble, but the economy was as well. The Wall Street community either missed all the warning signs or chose to ignore them. Otherwise, there was no reason for portfolios to be positioned aggressively. Perhaps it is worth taking into consideration whether or not Wall Street makes money when portfolios are not invested.

Our handling of all Bear Markets and corrections since the Internet Bubble proves that our approach to managing financial assets is highly effective and solidly grounded on extensive research and over 37 years of investing and trading experience. Furthermore, our balanced quantitative and qualitative process of analyzing financial markets and investments, proves that market timing to mitigate losses can be done. Perhaps not to the exact day or week, but feasible enough from a capital preservation angle. Therefore, it is only a matter of time until investors of all branches, from ultra-high net worth to retail, make market timing an imperative requirement for hiring portfolio managers.

Works Cited

Kaufman, Perry J., and Perry J. Kaufman. Trading systems and methods. Hoboken, NJ: Wiley, 2013.

Kirkpatrick, Charles D., and Julie R. Dahlquist. Technical analysis: the complete resource for financial market technicians. New Jersey: Pearson Education, Inc., 2016.

Lewis, Michael. The Undoing Project: a friendship that changed our minds. New York: W.W. Norton & Company, 2017.

Mandelbrot, Benoit B., and Richard L. Hudson. The (Mis) Behavior of Markets: a fractal view of financial turbulence. New York: Basic Books, 2004.

Montier, James. Behavioural investing: a practitioner’s guide to applying behavioural finance. Chichester: J. Wiley, 2007.

Murphy, John J. Intermarket Analysis. Wiley, 2013

Prince, Bob. “Risk Parity Is About Balance.” Bridgewater Associates, LP.

Disclaimer

The information and material presented in this document are provided for information purposes only and are not to be used or considered as an offer or solicitation to buy, sell or subscribe to any financial service, securities or other financial instruments.

This document does not take into consideration the specific investment objectives, financial situation or particular needs of any person who may receive this report and invest in any financial instrument. Greenwich Creek Capital Management LLC (GCCM) has not taken any steps to ensure that the securities or services referred to in this report are suitable for any particular investor.

This report is not to be relied upon in substitution for the exercise of independent judgment. The value and income of any of the securities or financial instruments mentioned in this document can go up as well as down. The market value may be affected by changes in economic, financial or political factors, time to maturity, market conditions and volatility, or the credit quality of any issuer or reference issuer. Furthermore, foreign currency rates may have a positive or adverse effect on the value, price or income of any security or related investment mentioned in this report.

Many factors may affect the value of a financial instrument, and accordingly, investors effectively assume all risks and may receive back less than they had originally invested. Any investors interested in buying a financial instrument should conduct their own investigation and analysis of the instrument as to the risks involved with transactions on such instrument.

Past performance should not be taken as an indication or guarantee of future performance and no representation or warranty, expressed or implied, is made by GCCM regarding future performance.

This document does not constitute the investment policy of GCCM or an investment recommendation, but merely the different assumptions, views and analytical methods of the analysts who prepared it. Furthermore, the information, opinions and estimates expressed herein reflect a judgment as of its original publication date and are subject to change without notice. GCCM may have issued other reports that are inconsistent with, and reach different conclusions from, the information presented in this report.

The information and opinions presented by GCCM analysts have been obtained from sources believed to be reliable. Although all reasonable care was taken in gathering the information and formulating the opinions contained herein, GCCM does not make any representation whatsoever as to its accuracy or completeness.

Accordingly, GCCM accepts no liability for any loss arising from the use of this document, which has been made available for information purposes only.

This report is issued by GCCM. This document may not be reproduced or distributed, either in part or in full, without prior authorization being obtained from GCCM.

This report is distributed by GCCM based in Stamford, Connecticut, USA. GCCM and its affiliates (or employees thereof) may or may not hold a position in or with respect to the securities mentioned herein.

This report is not directed to, or intended for distribution to or use by, any person or entity that is a citizen or resident of, or located in, any locality, state, country or other jurisdiction where such distribution, publication, availability or use would be contrary to law or regulation.