
There is no doubt that the stock market was extremely oversold before last week’s rally. Usually when that happens, a “rubber-band-effect” rebound takes place. So, what’s next? Will the rally continue or will it run out of gas? Should we expect a test of the March lows? We don’t have a clear answer, but here are some facts and technical perspectives to assist those without a plan.
Facts we know:
he S&P500 Index rebound occurred on very decent volume, not as much volume as on the way down but nonetheless, decent volume on the way up. (Positive Fact)
Sector leadership on Thursday’s rally was on utilities, real estate, healthcare and consumer staples—all four defensive sectors. Relatively speaking, defensive sectors performed better during Friday’s selloff than the leading sectors of the economy. Neither of these two scenarios is ideal for a sustainable rally. (Negative Fact)
Volatility remains stubbornly high and above 60, which in our view, is an indication that investors are nervous. (Negative Fact)
Credit spreads between high yield bonds and the 10 Year U.S. Treasury Note are still widening. Usually, credit markets anticipate a recovery before equity markets do. The widening of credit spreads is not a positive indication of an economic recovery yet. Furthermore, a decent amount of companies in the energy sector are issuers of high yield debt. Oil at or around $20/b is not a great help for those companies. On the contrary, if some of those issuers start defaulting on their debt, a domino effect can spread quickly within the energy sector and others, like financials. This would create a crisis in addition to the current COVID-19 crisis.
From a technical perspective:
- Only 14.2% of the S&P500 stocks are above their 20 EMA (Exponential Moving Average)
- Only 6.8% of S&P500 stocks are above their 200 EMA
- Higher numbers are needed for a sustainable rally
- The S&P500 closed at 2541.47 on Friday 27
- First resistance is 2644
- In Fibonacci numbers, oversold rebounds usually reach 38.2% (S&P500 = 2650) to 50% (S&P500 = 2793) retracement of the previous downtrend.
- If the S&P500 manages to close above 2644, we believe that the next battle between Bulls & Bears will be fought within those two levels: 2650 and 2793:
- If the S&P500 manages to close above 2793, the likelihood of a new uptrend increases.
- If it fails to hold 2650 or never moves above 2644, then the likelihood of a new test of the March lows increases, perhaps to form a double bottom or similar. Although this could be the beginning of a consolidation pattern or bottom formation, the problem with this scenario is that according to history, the March lows might not hold.
- To understand the magnitude of the market drop, consider that from its peak in February 19 to its bottom in March 23 the S&P500 lost -33.97% (closing prices). Therefore, in order to fully recover the index should now climb +51.52%.
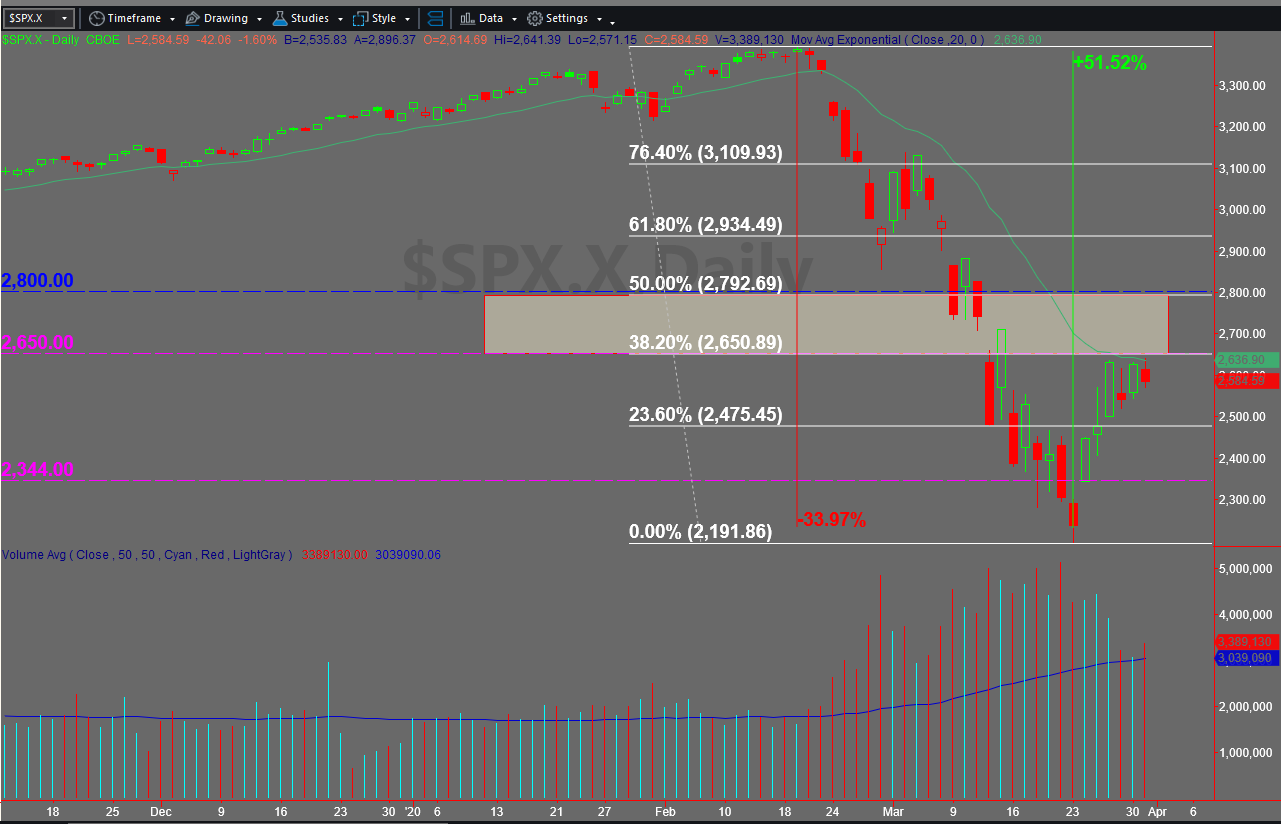
Chart provided by TradeStation


