The advantage of having a reliable analytical quantitative process in place is that we do not have to change our stance on the market in line with pundits’ daily narratives. Pretty much since February, the bulls within the S&P 500 index have been holding up their enthusiasm by allocating capital to commodities and the most defensive sectors of the U.S. economy, which is not enough to regain a long-term uptrend. It may produce bear market rallies to disguise investors, like the one in March but not enough to regain the upper hand. This is when a reliable and proven analytical process comes in handy, to differentiate the head fake from the real opportunity.
In our article published on March 3rd, we discussed The Relationship Between Stocks, Bonds & Commodities. Commodity prices are the last ones to peak at the end of the economic cycle. Some commodity prices are beginning to build lower highs and lower lows, which is usually the beginning of a down-trend. One of the main components we look at in this group is copper, which is 100% for industrial use. Dr. Copper, as it is well known in Wall Street for its ability to forecast global economic growth, seems to be breaking down from its uptrend.
The behavior of copper in addition to structural trouble in China’s economy, the burst of their real estate bubble, and the crackdown on the private sector, which is leading to lower investment in growth, does not bode well for the global economy.
The bottom line is that the strong sell-off on Thursday and Friday broadened downside participation even in the groups that were holding up the S&P 500. Some of these sectors, such as commodities, remain in uptrends for now but if the selling pressure persists the bears will have the edge and the stock market may grow more vulnerable.
Our broad market analysis turned bearish in late January and currently remains bearish amongst other variables because:
- Volatility remains high, with VIX between 20 to 30 and readings above the 30s. This bodes well for short-term reversals which are only suitable for the very nimble trader.
- Credit spreads are widening.
- Growth stocks in the Nasdaq 100 and Nasdaq Composite remain under selling pressure.
- The offensive groups of the economy continue to lag leadership.
- Our Market Trend Table continues to show a bearish Main Trend for most equity indices and leading sectors of the economy while showing bullish Main Trends for the US Dollar, gold, commodities, U.S. Treasury yields, and volatility.
- A flattening U.S. Treasury Yield curve at the time the Federal Reserve continues to deliver hawkish messages to investors, perhaps wrongly assuming that both economic growth and inflation are accelerating. This is typical of phase two in the economic cycle. The problem is that the economy is in phase four of the economic cycle. Therefore, the issue is that the Federal Reserve by being behind the curve (chasing) may end up leading the U.S. economy into a hard-landing recession.
Conclusion: we continue to protect capital by remaining extremely defensive and ready to capitalize on the recovery phase, which sooner or later will arise.
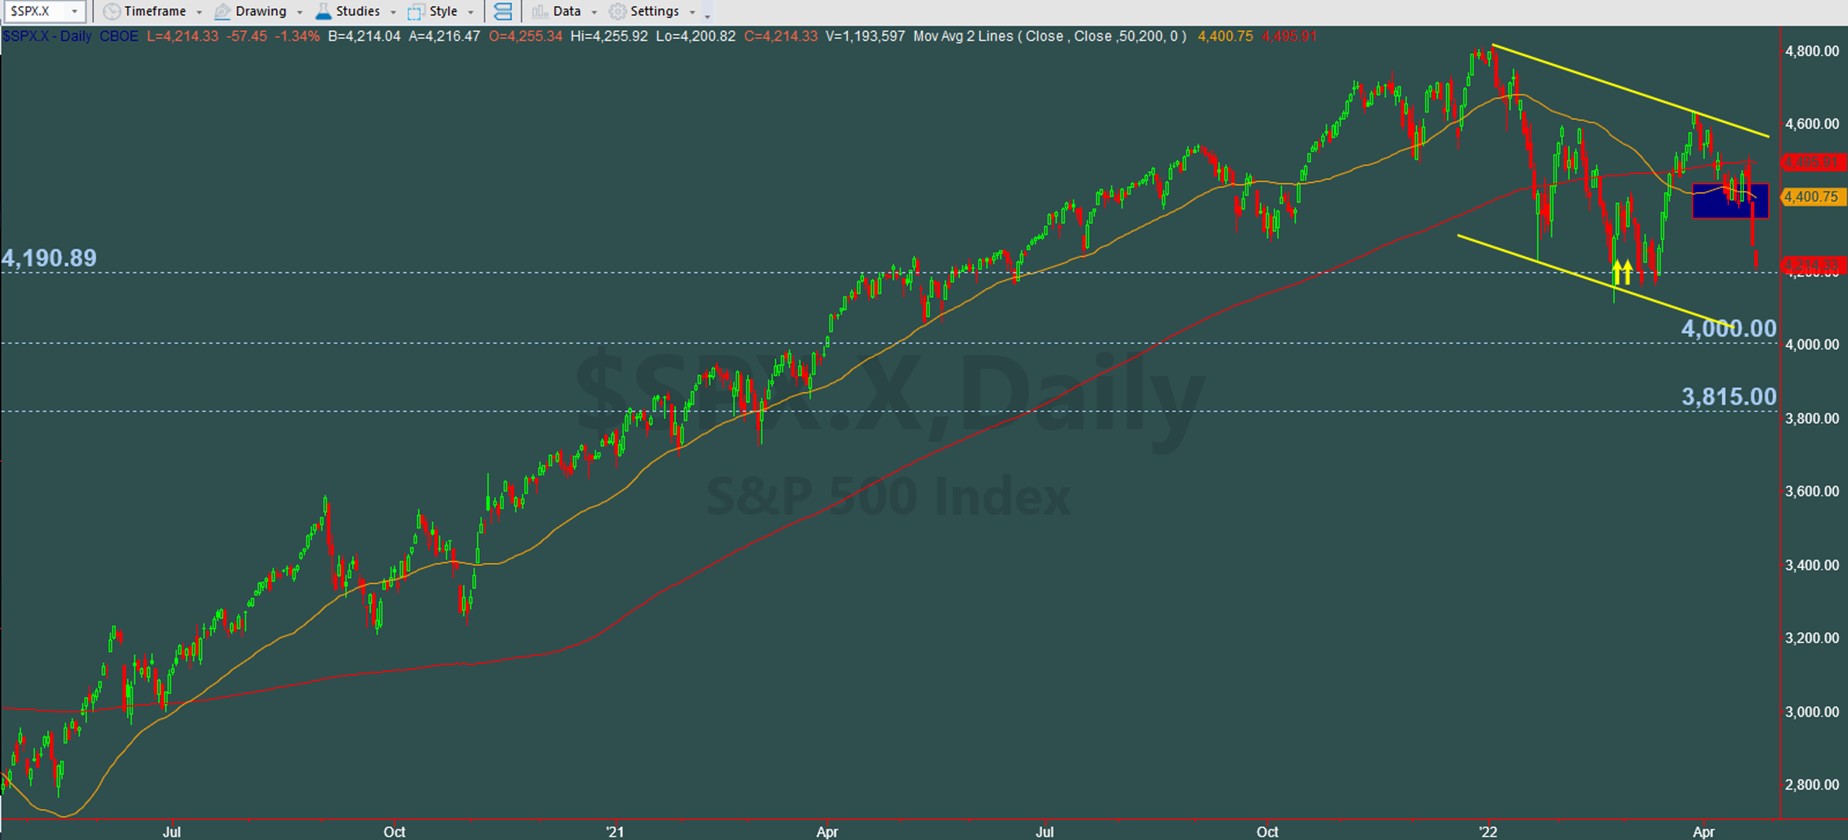
Chart provided by TradeStation
The chart above shows the S&P 500 Index on a downtrend since the beginning of 2022. The blue box indicates our first area of support. We expected the index to reach such a support area after the retracement of the March bear market rally. On Friday, April 22, the index pierced our support and it is now challenging 4190. If 4190 does not hold on a closing price basis, our next targets are 4000 and 3815.
From a short-term market perspective, Apple (AAPL), Microsoft (MSFT), Alphabet (GOOGL), Meta Platforms (FB), and Amazon (AMZN) will report earnings this week. Their results will determine investors’ interest in growth stocks as opposed to value. In our opinion, the balance between growth and value will determine the next leg of the stock market.
(*) The Greenwich Creek Capital “Index Trend Table” is not meant to be used in isolation, it is part of a more complex set of variables and it is not designed to provide trade entry and exit points.
Do you have a risk management strategy and a proven repetitive investment process to profit in bull markets and protect capital in bear markets? Check our website for more information about how we manage investment portfolios:
www.GreenwichCreekCapital.com
For High Net Worth Portfolios
And
www.FreedomInvest.com
The Active Asset Management Platform for Small Accounts.


