There are two main reasons for bond yields to move higher: (i) at the beginning of the economic cycle GDP growth accelerates with no inflation; therefore, bond yields and stock prices move up together in expectation of improving economic conditions, which translates into better earnings per share. (ii) At the end of the economic cycle GDP growth decelerates with spiking inflation due to higher commodity prices. In this case, bond yields move up in expectation of the Federal Reserve (FED) hiking rates to control inflation. This is when the decoupling of bond yields and stock prices occurs. In the first scenario, higher bond yields are an indication of economic expansion, thus the surge in stock prices. In the second scenario, higher bond yields occur in expectation that the FED will hike rates to slow inflation and cool economic growth. This is bad for stock prices.
Additionally, higher volatility (VIX) readings, which result in big swings in the stock market, are typical of a late phase 4 economic cycle. Keep in mind that the stock market typically collapses in late phase 4. In this case, the best scenario would be a cyclical bear market lasting approximately a quarter or two. This is exactly where the stock market appears to be now, manifesting strong commodity prices (inflation) and weakening stock and bond prices (lower bond prices = higher yields). Usually this type of behavior marks strong turning points in both the financial cycle (stock market) and the economic cycle. Bond prices peak first, then stocks and lastly commodity prices in this order. Bond prices (TLT) peaked in early December (chart 1), stock prices (SPY) in early January (chart 2) and commodity prices (DBC) peaked on March 8th (chart 3). This is not good for bonds, stocks or the economy.
The end result is stagflation, where GDP growth slows down sometimes to even negative readings with accelerating inflation. This is the worst scenario for the FED because they will have to hike rates to control the spiral in inflation at a time in which GDP is already slowing down. The end result is never good. We believe investors are trying to quantify a hard landing of the economy, hence the volatility issue. And we do not believe we have seen the worst yet. We expect another sharp leg down and only then a possible credible bounce.
Chart 1
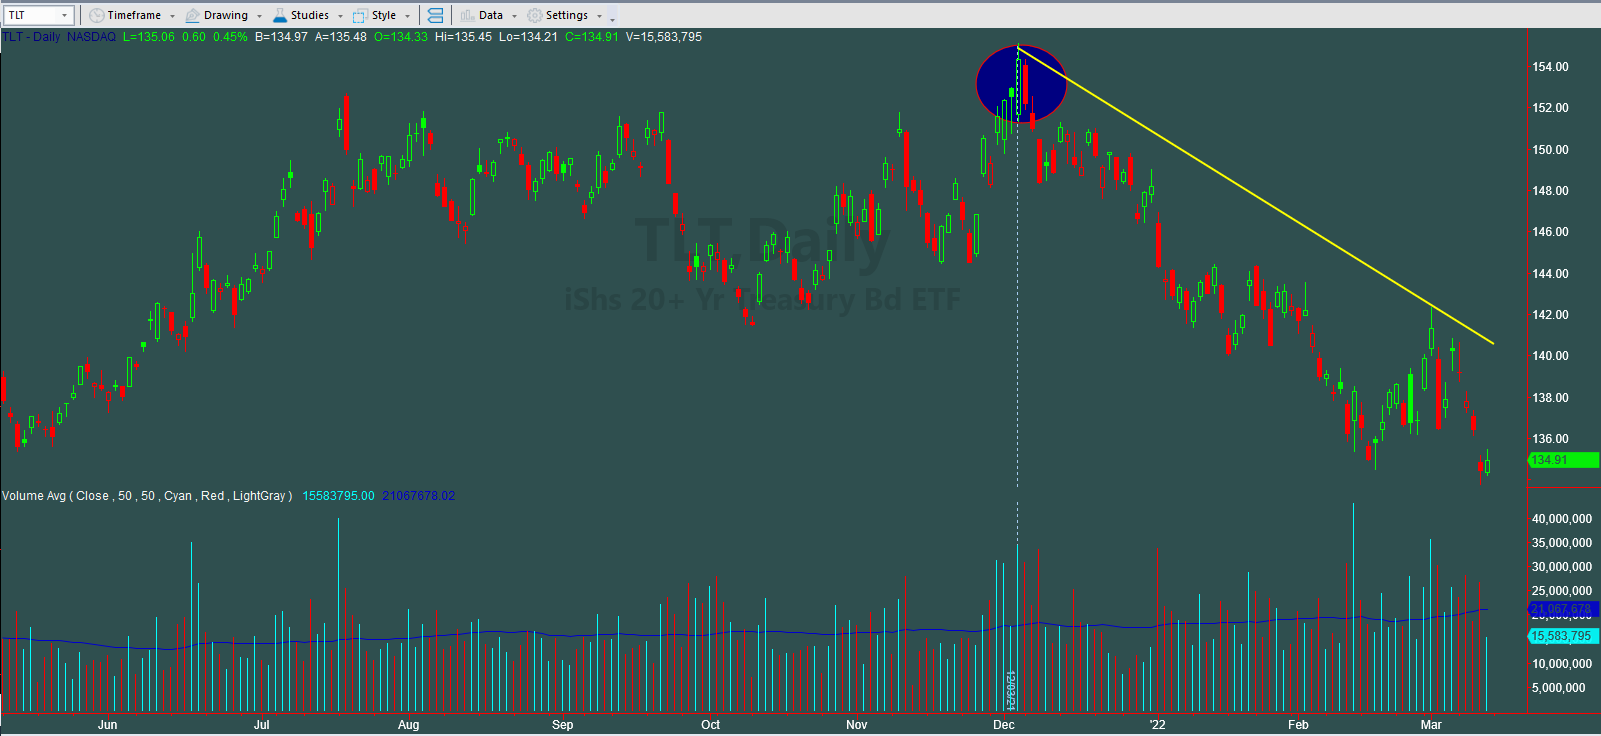
Chart provided by TradeStation
Chart 2
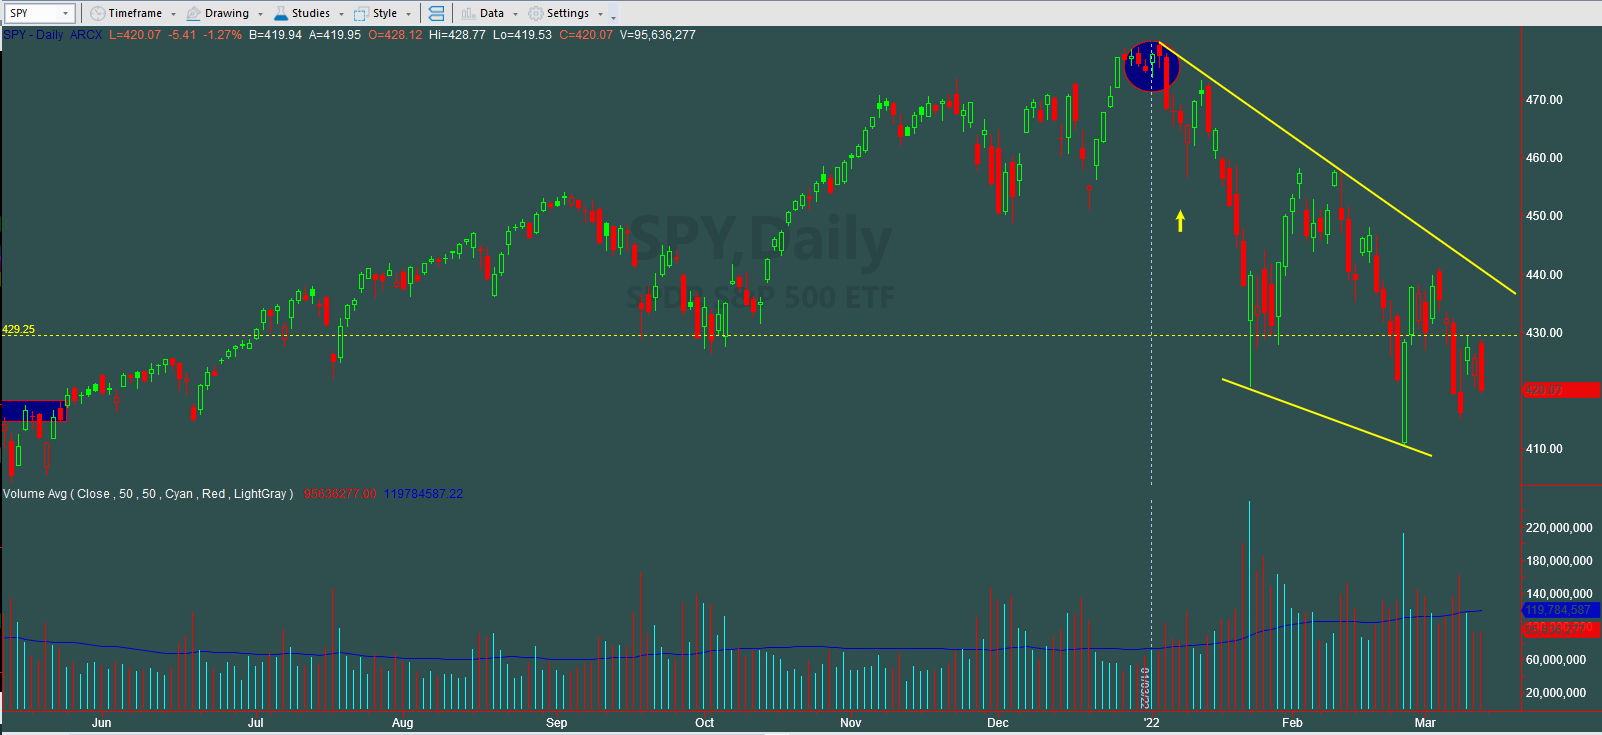
Chart provided by TradeStation
Chart 3
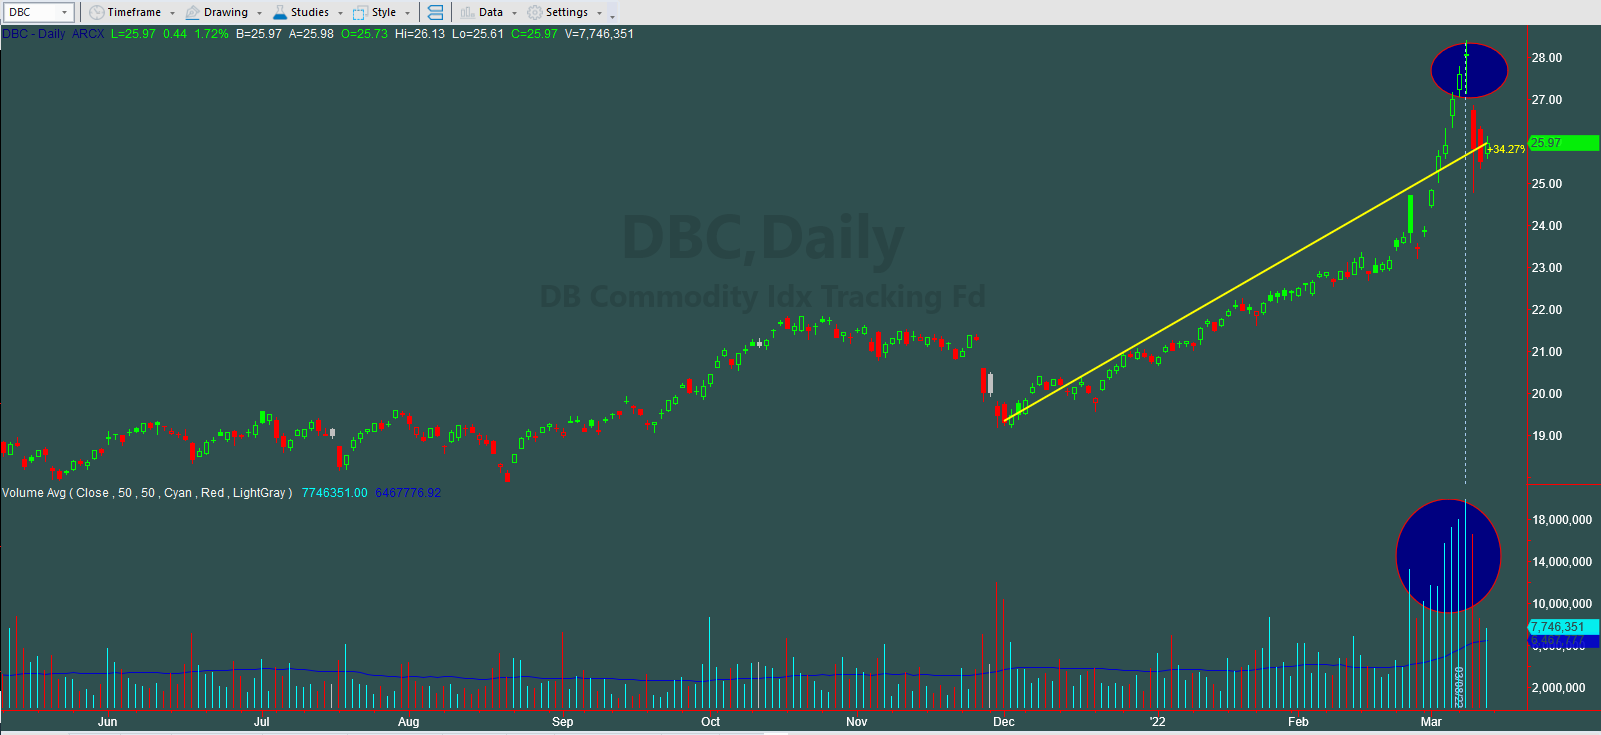
Chart provided by TradeStation
This is not the time to be a hero in the stock market. Not when most stocks are in downtrends. It is the time to be defensive to protect capital. We started hedging our clients’ portfolios in mid-January and will continue to do so effectively protecting capital until our quantitative analysis signals Bullish Main Trend for the S&P500 Index.
(*) The Greenwich Creek Capital “Index Trend Table” is not meant to be used in isolation, it is part of a more complex set of variables and it is not designed to provide trade entry and exit points.
Do you have a risk management strategy and a proven repetitive investment process to profit in bull markets and protect capital in bear markets? Check our website for more information about how we manage investment portfolios:
www.GreenwichCreekCapital.com
For High Net Worth Portfolios
And
www.FreedomInvest.com
The Active Asset Management Platform for Small Accounts.


