
Before you start reading this article, it would be a good idea to first read our last article published on February 10th here. We discussed volatility, some market fundamentals and technicals, including a possible selloff, which we have been discussing for a while. The article’s conclusion was that the stock market was entering a period of consolidation (sideways movement), but remained in an uptrend, with a possible drop of -3.7% to its 1st range of support, -5.75% to the 2nd range of support and -7.6% to its 3rd range of support. In fact, by Feb 24th, two weeks after we wrote the article, the S&P500 gapped down, reaching all our support levels mentioned. The index is down approximately -12.6% to -13% from its peak at the time of this writing.
The simple explanation for such a vigorous selloff is that investors do not like uncertainty. Financial markets can anticipate and set pricing on pretty much anything quantifiable. The problem with the present situation is assessing how much damage the Coronavirus (COVID 19) will cause to the global economy. Therefore, when “uncertainty” is the common denominator, investors usually get out of the way.
No doubt that a cautious stance is the prudent approach to the current market environment. The uptrends and bullishness of both S&P500 and Nasdaq have been seriously damaged and merit a reassessment.
Long term: Most investors are optimistic by nature and believe that a vaccine will be available soon and financial markets will recover. The question is how soon is “soon” and from where will financial markets and economies recover. No one really knows. This approach does not help much in terms of risk management.
Short term: Manage your portfolio risk, plan your trading and positioning, and trade accordingly. In practical terms:
- After a selloff of the magnitude we’ve seen last week, it usually takes 6 to 11 or 12 weeks for markets to stabilize.
- In the meantime, with an oversold stock market and overbought volatility, a slight short term recovery is possible.
- Then a retest of support (previous low) is possible too.
- At that point, if the test of support fails, all bets are off. If the stock market successfully retests its low, then a longer term recovery is possible (key word: possible).
- Ignore the sensationalism of the news flow as much as you can.
In normal circumstances (and these are not normal circumstances due to Coronavirus) the following facts at Friday’s closing make us believe that a short term reversal could be possible, not necessarily long lived, but possible nonetheless:
- Gold (GLD) sold off sharply on heavy volume during the day, which helps the case for a stock market bounce.
- 10 year Treasury Yield moved sharply lower in the morning, recovered in the afternoon and closed at the lowest level of the day (1.127%). This does not help the case for a reversal.
- Volatility (VIX) spiked above 49 during the day and closed at the bottom of the day’s range and below the opening. This fact helps the case for a bounce.
- Although the S&P500 sold off on heavy volume, it recovered to close at the top of the day’s trading range and above the opening price, helping the case for a short term reversal.
- Semiconductors, is outperforming the S&P500 on a relative basis and not breaking below its December lows, while the S&P500 is struggling to hold the October lows. In our opinion, if this key industry continues to hold the December lows, it helps the case for the stock market reversal.
Conclusion: The bottom line is that the stock market suffered serious technical damage. Both the S&P500 and the Nasdaq are now in bear trends and the Coronavirus makes the current market condition very abnormal. Therefore, even IF a short term rally takes place from the current oversold condition, a proper reassessment of participation and other variables should be made at that time to figure out if the bounce has strength to continue up or if it’s the last opportunity to get out of the way and protect your capital from further losses.
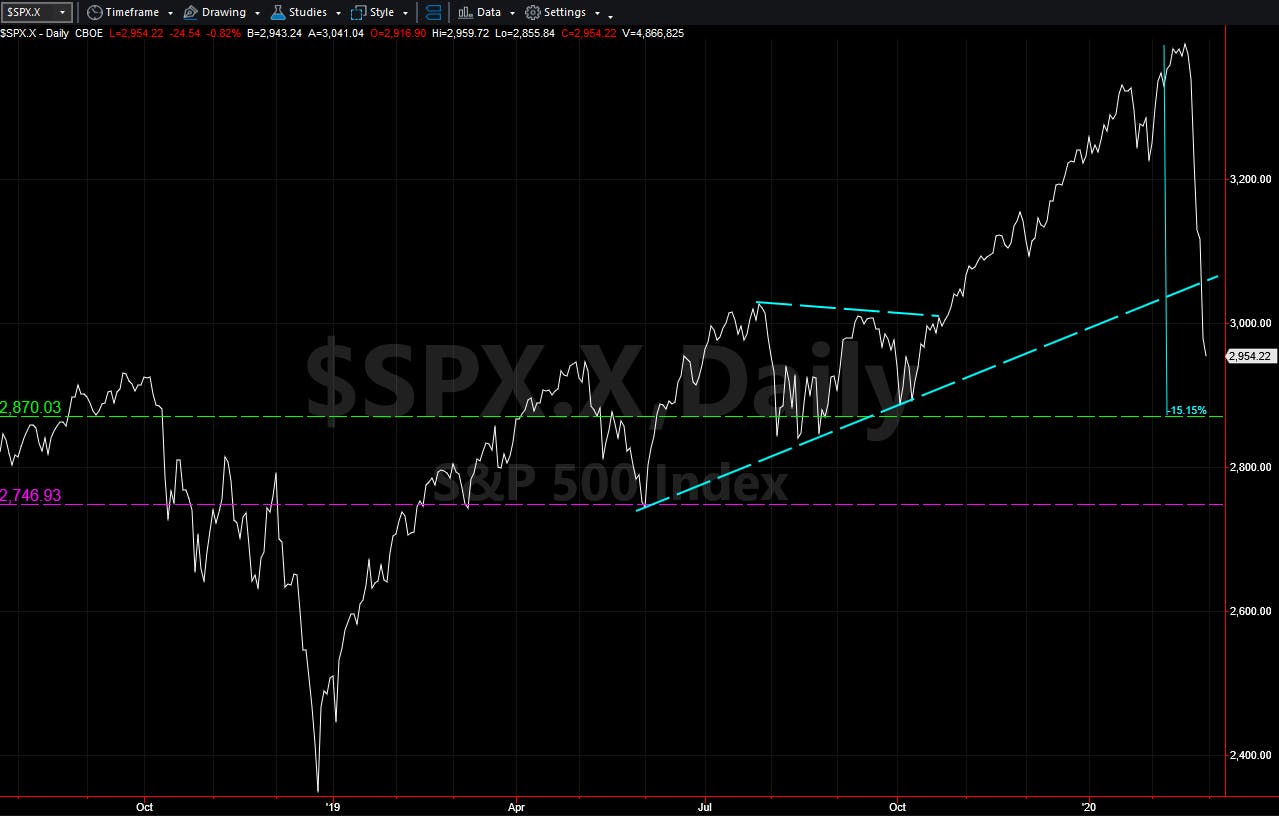
Chart provided by TradeStation
Quantifying a Further Fall: As indicated in the above chart, after a sharp leg up (December 2019 to February 2020), a 50% retracement is possible and even normal in bull markets. That number in the S&P500 index is a test to 2870 (green horizontal dotted line).


