With the stock market at an all-time high and the peak in earnings way behind us (third quarter (3Q) 2018), clients are mostly interested in whether the next stock market collapse is near. Let’s do some simple analysis, which is usually the best recipe in complex matters: keep it simple!
Bond market action suggests bondholders would like to see the Federal Reserve (FED) lower interest rates to weaken the US dollar and inflate the economy. Current economic data suggests the FED may stay on the sidelines, unless, for example, coronavirus gets out of control or the U.S. economy risks entering a recession. Either one of those situations or both combined would have a negative effect on the global economy. In such case, investors will have to reassess all their estimates and the equity market should move down. Regardless, the current economic environment seems very amicable to equities: moderate growth, low inflation, low interest rates and a FED that, although on the sidelines, is not likely to increase rates anytime soon. If anything, it seems the FED may be more willing to lower rates, than to increase them. Such a move would help steepen the yield curve, which should be positive for stocks.
GDP growth, earnings per share and sales have been slowing down since their peak in 3Q 2018. However, it’s not likely that the US economy will go into a recession any time soon with healthy labor and housing markets, low inflation and an ISM Manufacturing Index back into expansion. On the other hand, bond investors are pushing bond yields lower and the yield curve is modestly inverted between T-Bills and one to seven year Notes. Perhaps bond investors are not comfortable with the increasing spread of coronavirus and its negative effect on the global economy.
What could change the overall friendly environment for equity investors? A sudden and wild upward move in inflation would take the FED out of hibernation. An abrupt increase in interest rates to fight inflation will derail both bond and equity markets. Is it possible? Yes. Is it likely? In our opinion, not for now.
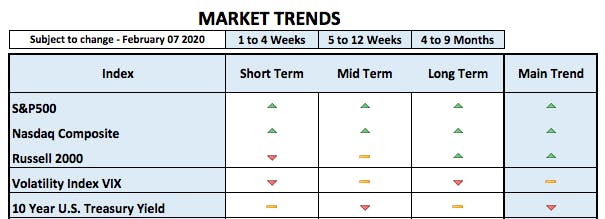
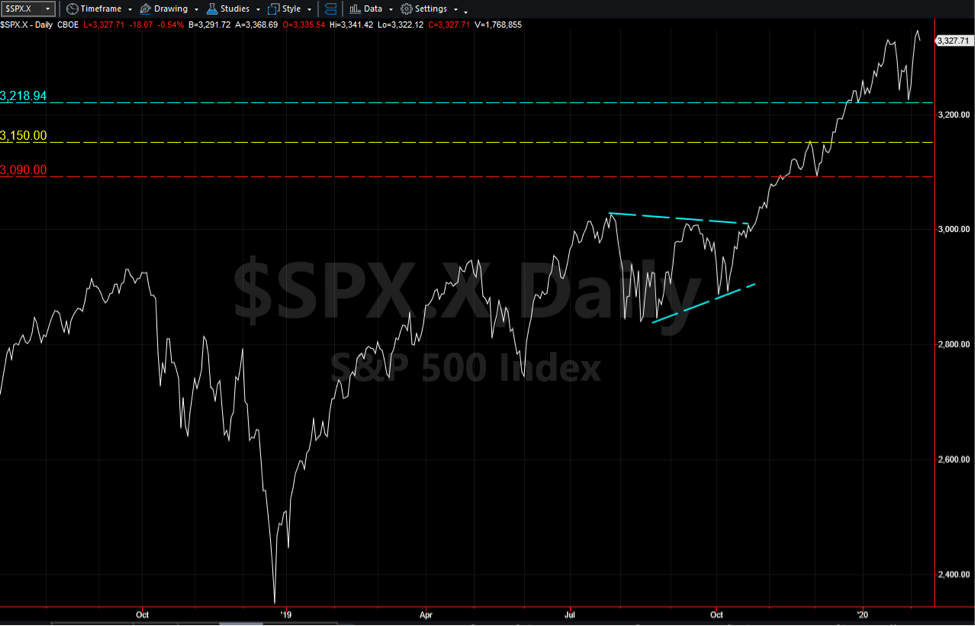
From a technical analysis perspective, the S&P500 and Nasdaq sold off in late January, but held their early January lows and from there, both surged to establish a new high (See S&P500 chart below). The S&P500 Equal Weight and the Russell 2000 Small Cap broke below their early January lows and never recovered to their late January highs. Nonetheless, all four indices are in uptrends.
Regardless of uptrends, there is an increase in volatility, which is negative for stocks. The correlation between volatility and stocks is almost always inverted. Volatility moves up and stocks move down; volatility moves down and stocks move up. In bull markets, an increase in volatility usually indicates the beginning of a “consolidation pattern” to ease an overbought condition. The consolidation period can be (1) short with a sharp selloff, creating a pullback or even a correction, (2) or can evolve throughout several weeks in a horizontal sideways pattern. Either way, the overbought condition is solved and at that time, the market resumes its original uptrend.
Is this scenario possible? Yes. Is it likely? In the current economic environment, our qualitative and quantitative analysis indicates that it is indeed possible. As we move forward and the economic environment changes, we shall reassess.
Conclusion: It seems that the stock market is entering a consolidation period. If this is the case, the question is how will the consolidation period manifest itself? The U.S. stock market, however, remains in bull mode.
Quantifying a Pullback: As indicated in the above chart, our first range of support for the S&P500 is 3220 (-3.7%) from Friday’s closing. Second range of support is 3150 (-5.75%) and third range of support is 3090 (-7.6%).


