
During the last few days we’ve all heard that the current level of the S&P500 Index is “key,” but I’ve heard very little in terms of why it is key. More important, what can make the index pivot up or down? In this Market Comment I’ll address both, the key level and the road map to determine the next leg, whether it is up or down.
The S&P500 is probably the most widely followed index, because it is considered to be a mirror of the US economy. Therefore, determining the direction of the index may help us to understand the direction of the real economy as it is understood by financial markets. Keep in mind that the financial cycle moves in anticipation and ahead of the economic cycle. By financial markets I mean both, stock market and bond market. And they don’t seem to be completely aligned: but only one will be right.
By taking a quick look at a short term chart of the S&P500 (see chart below), one can conclude that the index has been in a consolidation pattern moving neither up nor down since mid-April to mid-May (gray box). Notice that the previous short term trend from March 23 to mid-April is up. During the consolidation pattern the index has been able to hold 2800 support (blue dotted line) twice (blue arrows) by successfully testing it in early May and then again in mid-May. The resistance area or upper end of its trading range was 2934, which was tested in late April and twice in mid-May (yellow arrows). During the second test of resistance the index managed to break out and closed above 2934. On Friday 22nd the index closed at 2955.45. With this surge and breakout, the short term trend of the S&P500 is up again. The immediate challenge of the index is now 3000, which is the real make or break level for the index (see blue box in the chart below).
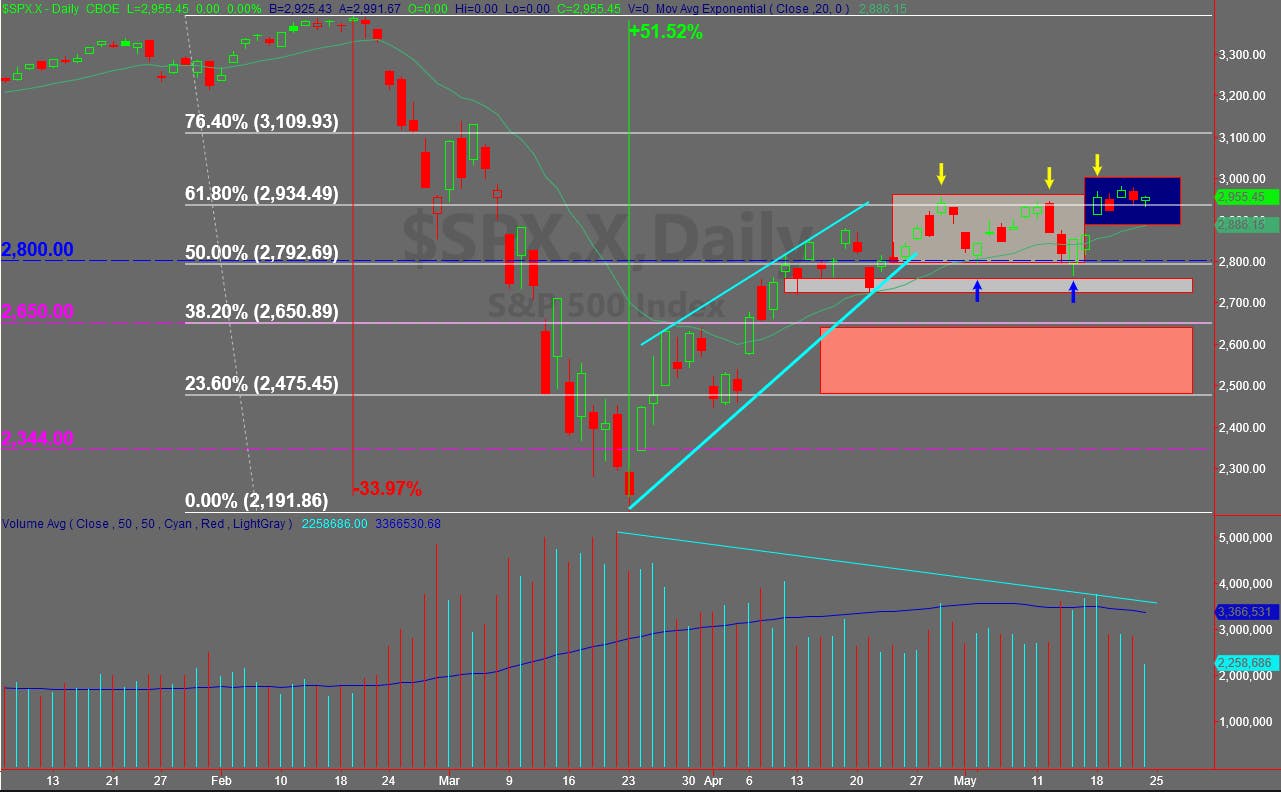
Chart provided by TradeStation
While all of the above is a positive move up and may be supportive of a continuation higher, the S&P500 is now at a key retracement (61.8%) of its previous move down from late February to March 23rd. That was a whopping -33.97% drop in value. The index has now recovered 61.8% of the previous move down. This is a Fibonacci number followed by many institutional and retail traders and investors. Normally, a bear market rebound may recover anywhere from 50% to 61.8% of the previous downtrend. Therefore, this is the moment of truth for the index. It will either break out from 3000 (top of blue box), with a possible later test of the new support area at 3000, which was previously resistance, or it will rollover from where it is now (~2955) to make a test of the immediate support level at 2886 (bottom of blue box). The failure of a test at 2886 support, increases the chance of a test at 2800, which is the next immediate support. If 2800 fails, then the next two areas highlighted on the chart come into play. And this is why the S&P500 is at a “key” level.
This key level should be closely watched because the long term trend of the index remains down and most of our indicators remain bearish. These are the same indicators that allowed us to timely catch every bear market and every recovery since the internet bubble, including the mortgage crisis and the current sudden drop due to Covid-19.
On the other hand, technology, health care and communication services are in uptrends. These three sectors represent 51.9% of the index. Additionally, the laggard sectors also caught investors’ interest last week. This trend should continue for a broad market participation in the uptrend, which is important for a sustainable bull market.
The US Treasury yield curve is steep and not inverted like it was at certain point in 2019. An inverted yield curve, where short term rates are higher than long term rates, occurs in anticipation of an economic slowdown or even a recession. And it is clear that the Federal Reserve and the US Treasury will do absolutely everything through monetary and fiscal policy to recover economic growth.
Equity investors seem to be very much in line with the belief that the FED and the Treasury Dept. will be able to pull a bull market out of the hat. But regardless of the steepness of the yield curve, the benchmark 10 year Treasury Yield refuses to move up with equities. In my view this could be an indication that not enough money is rotating out of safety (Treasuries) and into risk (equities). This type of rotation would help the bull market case. We are closely monitoring the relative performance of Treasuries and the S&P500, as well as Treasuries and High Yield bonds to determine if the trend favors equities and risk or favors the safety of US Treasuries and gold. After all, stagflation is possible and perhaps the worst case scenario if equity investors are wrong.
Do you have a risk management strategy in place to protect your capital? Check our website for more information about how we manage investment portfolios: GreenwichCreekCapital.com
Saul A. Padilla, RIA
Portfolio Manager


