Due to short-term strength in the stock market back in mid-August, I titled my previous article with the following question: “Is the Bear Market Over?” The first sentence of the article provides the answer: “The short answer is no, not yet.”
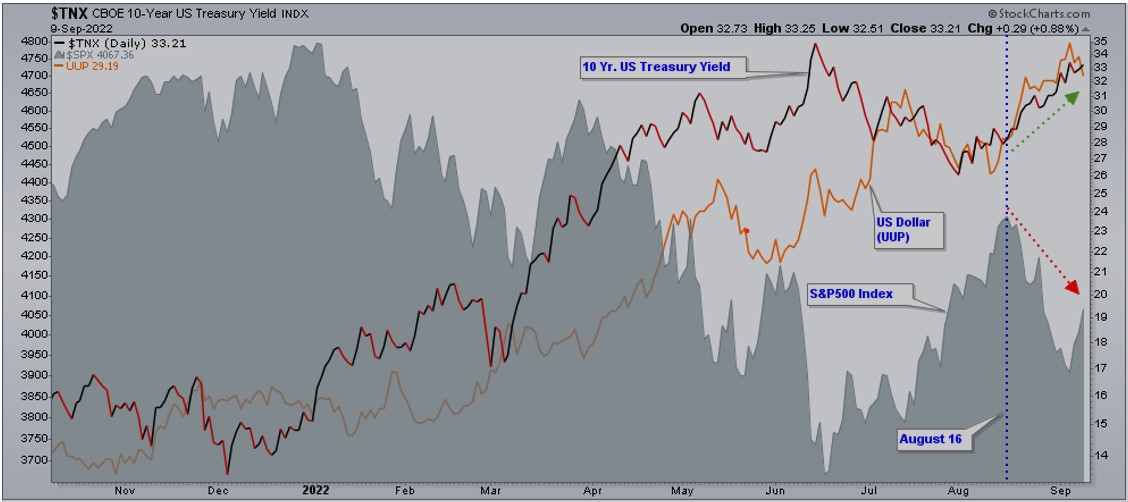
I finished the article with the following sub-title and comment: “Falling Dollar and Surging Socks: If the strength in the stock market is just another bear market rally, this move higher could last as long as momentum remains strong. In our view, a breakout in the 10-yr Treasury Yield and a breakdown in the S&P 500, would likely suggest that the bullish trend of the US Dollar will resume along with the bear market.” That is exactly what happened since August 16th, a higher US dollar, a higher 10-year US Treasury yield, and a lower S&P 500 Index (chart 1).
Chart 1
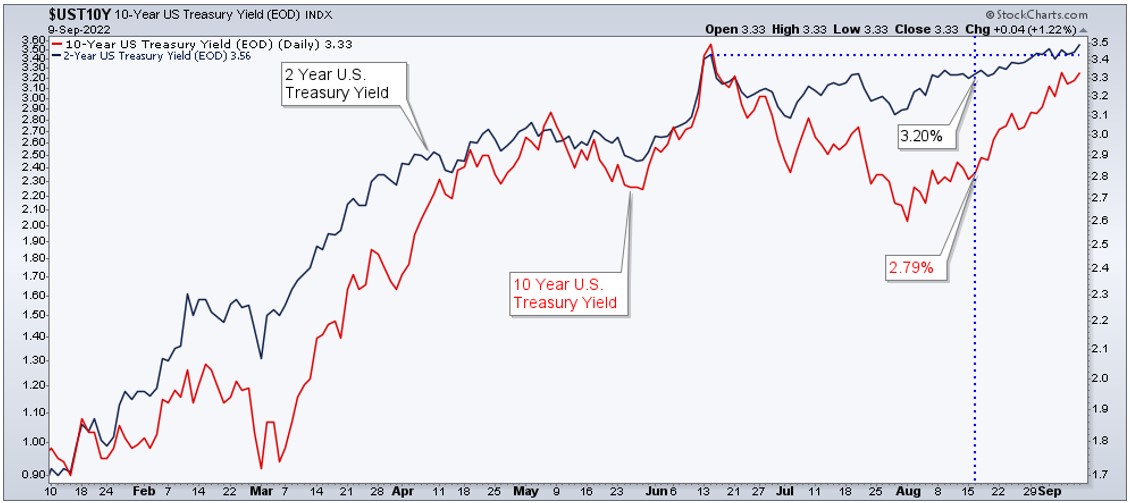
In the meantime, the bond market seems to believe that the fight against inflation is far from over. Chart 2 shows the yield of the 2-year Treasury Note at 3.20% on August 16 and the 10-year yield at 2.79%. The 2-year Note is at 3.56% now, which is above its June high and the 10-year yield closed on Friday at 3.33%. Although the spread between the 2-year yield and the 10-year yield has narrowed from mid-August to now, the yield curve remains inverted in anticipation of an economic recession.
Chart 2
Simply said, the problem is that the Federal Reserve is on a mission to crush inflation, and to accomplish it, they have to raise interest rates in an economy that is already slowing down. Higher interest rates have a negative effect on spending and consumption, demolish investments in the real economy and generate corrections in asset values.
Last I checked, investors have priced six additional rate hikes into Fed Funds futures by year-end. What does this mean for an already weak housing market? Perhaps that 7% mortgage rate is not an absurd fact by year-end. This is important because according to the National Association of Home Builders (NAHB) housing’s contribution to GDP generally averages 15-18%. Home Construction (ITB, $DJUSHB) is down -30.2% year-to-date and it is hard to believe that in an environment in which interest rates are moving higher home construction will show any improvement. We shall continue to monitor the yield of the 2-year Note for signs of improvement in inflation, which should trigger a positive reaction in bond and stock market prices.
Every time the stock market drops, there is broad participation to the downside. Nevertheless, stocks ended the week on a positive note helped by a short-term oversold condition, but our quantitative process still signals a bear market condition. In other words, the main trend of stocks remains down. Perhaps this is due to the fact that the following remains true:
- Credit spreads remain too wide signaling stress in credit markets.
- Rising interest rates.
- Bond prices including investment grade, high yield, and junk bonds remain in down-trends.
- Semiconductors ($SOXX) are in a downtrend.
- Retail sector (XRT) is on a downtrend.
- Construction (ITB) is on a downtrend.
- The Main Trend of volatility remains bullish, which is negative for stocks.
- Utilities (XLU), a defensive sector of the economy, and the US Dollar (UUP) both are on an uptrend.
- Within energy, we found uptrends in renewable energy stocks.
- Points 8 and 9 are not enough for a sustainable bull market.
Conclusion: At the time of this writing it seems that the best case scenario is that the S&P 500 low is already in (mid-June lows) and momentum regains strength, but a sustainable bull market is not in sight yet. If in fact the low is in, the stock market may just go directionless for some time until the 2-year Treasury yield indicates that bond investors expect subdued inflation. The worst-case scenario is that the June low does not hold and the stock market breaks down.
What do I mean by directionless stock market? It means that the S&P 500 will trade within a range defined by volatility (VIX) between the low 20s and high 20s. This range of volatility is what we call the chopping board area because VIX is on a bullish upward trend which sooner or later is negative for stocks. Therefore, when VIX moves down to the low 20s, like now, the S&P 500 moves up with commodity prices. The price of the US Dollar (UUP) together with the 10-year Treasury yield moves down. There are only two possible trades in this environment, (i) if you are not an expert trader you stay out of the market, or (ii) you fade (short) de S&P 500 and commodities while buying UUP and shorting the 10-year Treasury. When VIX reaches the high 20s you do the opposite. Note that this strategy is only good for nimble expert traders.
Check the Main Trend of stock indices, volatility, yield, currencies, and much more here.
Consider not being fully invested, taking on smaller position sizes, and holding a higher allocation of cash.
(*) The Greenwich Creek Capital “Index Trend Table” is not meant to be used in isolation, it is part of a more complex set of variables and it is not designed to provide trade entry and exit points.
Do you have a risk management strategy and a proven repetitive investment process to profit in bull markets and protect capital in bear markets? Check our website for more information about how we manage investment portfolios:
www.GreenwichCreekCapital.com
For High Net Worth Portfolios
And
www.FreedomInvest.com
The Active Asset Management Platform for Small Accounts.


