November 27, 2018
The Christmas rally, or “Santa Claus rally,” happens usually during the last couple of weeks of December and may extend into January. According to Investopedia, the rally has yielded positive returns in 34 of the past 45 holiday seasons since 1969!
Three things we are looking at for clues of the Christmas rally:
- Lower Volatility (VIX). The best stock market gains are usually made in a low-volatility environment. Low volatility means readings of 15 and below. The October breakdown brought just the opposite: increased levels of volatility of over 16. The Christmas rally can occur with volatility levels of around 16 like we saw in the late October bounce. However, a sustainable rally will require volatility to cool down. Ideally, below 15. Yesterday’s closing was 19.02. The lower the level of volatility, the longer the rally can sustain itself.
- Slower U.S. Economic Data. Among others, we will see consumer sentiment and manufacturing, employment, and payroll data released before Christmas. The thought process here is that slower economic data may take pressure off the Federal Reserve (Fed) to move rates up one more time in late December. Additionally, the Fed plans to raise interest rates three more times in 2019 into a global and U.S. economic slowdown. As we discussed last week, this would be a huge mistake because it may create a recession in the U.S. Therefore, somehow disappointing economic data may release pressure from the Fed to increase rates (even if it is in 2019). This may bring optimism to investors.
- Widening Yield Spread. A widening yield spread is an indication of a normal (not inverted) yield curve. A widening spread would probably lead to a short-term rally. It can be due to a change in the Federal Reserve’s rhetoric or simply a strengthening 10-Year Treasury Yield. Ideally, both. A widening spread would ease investors’ fears of an inverted yield curve and an incoming economic recession induced by the Fed.
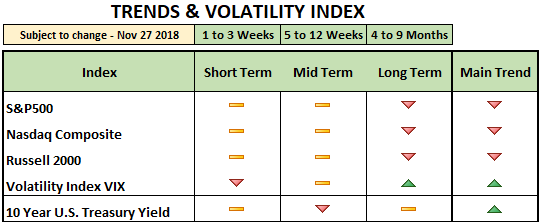
To conclude, there are a few short-term variables playing in favor of the Christmas rally. The S&P500 is near the October bottom (oversold), which may encourage buyers to enter the marketplace. Historically, the seasonal period after Thanksgiving tends to be bullish for equities. Additionally, some of our technical indicators are suggesting a short-term rally is possible. For now, the market’s downturn (approx. -9% from the October highs) still qualifies as a mere corrective period. Corrective periods within bull markets are usually buying opportunities. However, the main question is whether or not the rally, if there is one, will be sustainable. Our main trend indicators are bearish for the three major stock indexes (see table below). If we fail to have the Christmas rally this year, however, we can expect to see substantial damage to the price charts in the longer-term. If this happens, the market will require much more time to heal and recover. Needless to say, the loss of capital…