February 18, 2019
The battle between Bulls & Bears to determine the next leg of the US stock market continues. Although some technical indicators have recovered substantially, our quantitative and qualitative process to analyze financial markets continues to indicate that both S&P500 Index and Nasdaq Composite are in bear trends.
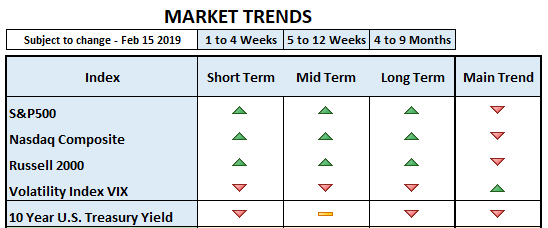
Before we continue, let’s conceptualize the word trend in our model, which is the same one that allowed us to successfully avoid every bear market and correction since the internet bubble. To determine the main trend of the stock market, it is necessary to figure out the short, mid and long term trends as defined by our model (see table). Without a clear sense of direction of the index in question within each different time frame, it is not possible to figure out the direction of the main trend. The speed at which the trends change direction depends on the depth of the stock market moves, whether up or down.
For the first time since the December lows, the short, mid and long term trends are bullish. The first one to change from bearish to bullish was the short term trend, followed by the midterm in early February and lastly the long term. But the main trend on all three indexes remains bearish.
In our model, the main trend can be broken into three minor individual trends. The minor trends must all be aligned in the same direction for the main trend to change. As of Friday’s closing prices, all three are aligned in the same direction (bullish). This is not surprising considering certain bullish developments: small-cap companies leading and broadening rally participation. Most likely, the main trend will change to bullish. Whether and when that happens remains to be seen…
So, why is our model still bearish? Perhaps a combination of variables:
- Economic data out of Europe, including Germany continues to deteriorate.
- The Atlanta Fed slashed its Q4 2018 GDP estimate to 1.5% due to weaker retail sales. It is a substantial drop since the original estimate of upper 3%.
- As of Friday morning, 391 companies out of 500 in the S&P 500 Index, reported sales growth of 6.73% and earnings growth of 13.79%. Definitely a slowdown since the 3rd Quarter of last year.
- In technology, specifically, 57/68 in the S&P 500 reported sales growth of 0.71% and earnings growth of 4.95%.
- GDP, sales and earnings are slowing down. In this scenario profits contract. Given stocks’ behavior, investors must be assuming that in 3-6 months from now we are going back to higher GDP, accelerating sales and expanding earnings. How? Monetary policy? Perhaps, but doubtful, unless Jerome Powell starts lowering interest rates now and no later than tomorrow.
- U.S. Treasury yields refuse to move higher, which is not a sign of an expanding economy. It is more of an indication of slower economic growth in the months to come. It may be suggesting that monetary policy will not be enough to stop an economic slowdown.
In any case, we are still following the trading plan we originally shared on our January 7th (click here for details). I would not underestimate the behavior of the 10-Year Treasury Yield, regardless of the strength in the S&P500. If the 10-Year Yield continues to weaken, I would diversify by gaining exposure in defensive areas like Treasuries and cash. Bottom-line: We believe that in order for the stock market rally to be sustainable, Treasury yields have to move higher.


