The inflation number reported today in the morning before the stock market opened, was better than expected and the stock market rallied on expectations that the Federal Reserve (FED) can slow down the pace of interest rate hikes.
Conclusion: Our quantitative process indicates that we should remain defensive and the Main Trend of the S&P 500 Index (SPX) is still bearish. I’m open to the idea that this move up might be the beginning of a new leg up (bear market rally) and eventually the resumption of the Bull Market.
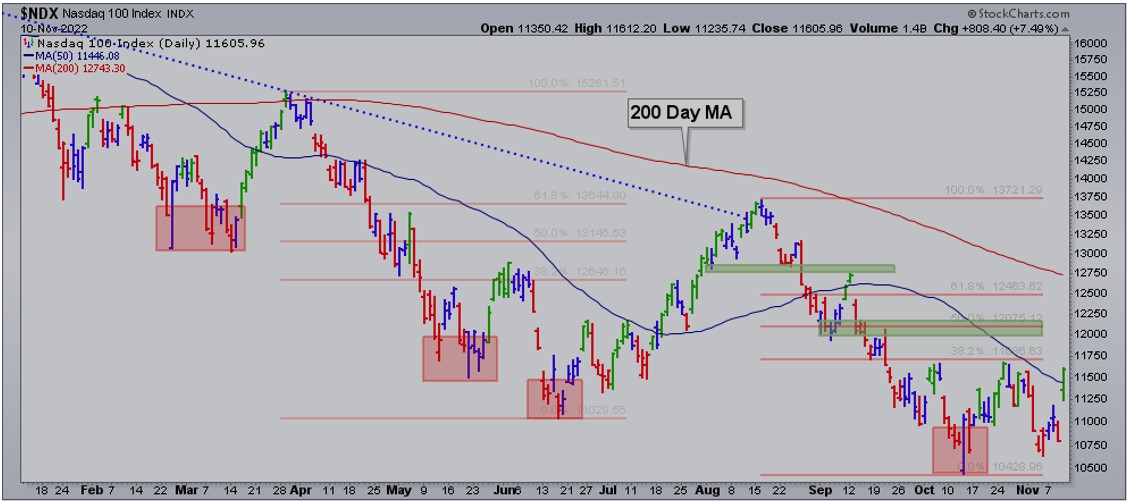
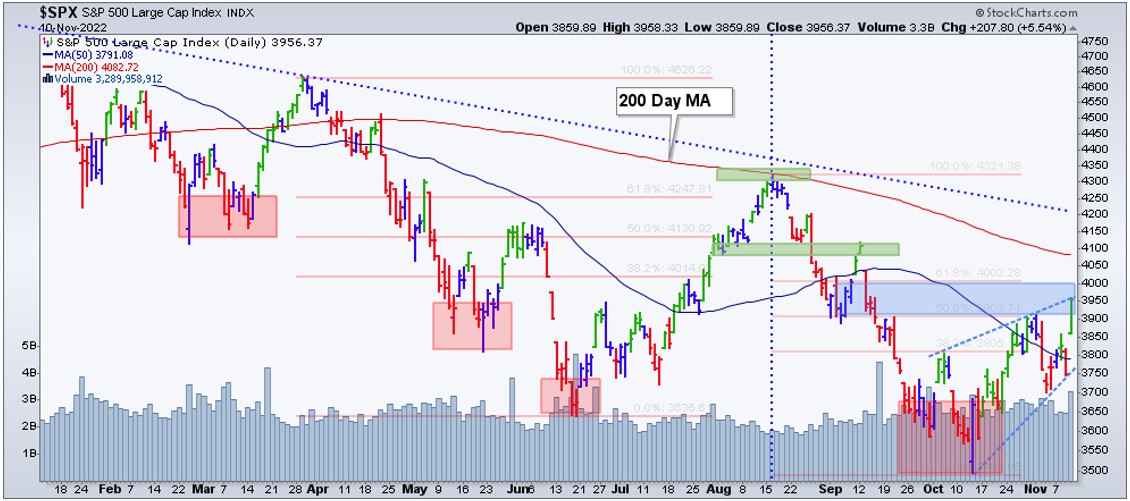
Bottom line: Today the SPX rallied 5.54% and the Nasdaq 100 (NDX) rallied an impressive 7.49%. Regardless, NDX is not even above its October peak yet (chart 1) while the SPX moved above its October peak and entered the 50% to 61.8% retracement area from the previous downtrend (blue-shaded area on chart 2). While this retracement move is completely normal in bear market rallies, the ascending wedge under the blue area is usually a bearish formation. Most of the time, but not necessarily all of the time, this type of consolidation is a continuation of the previous trend, which in this case is down. Nevertheless, the SPX now might have enough gas to reach the next two levels of resistance: (i) 4080, and (ii) 4200 before resuming the down-trend.
Chart 1
Chart 2
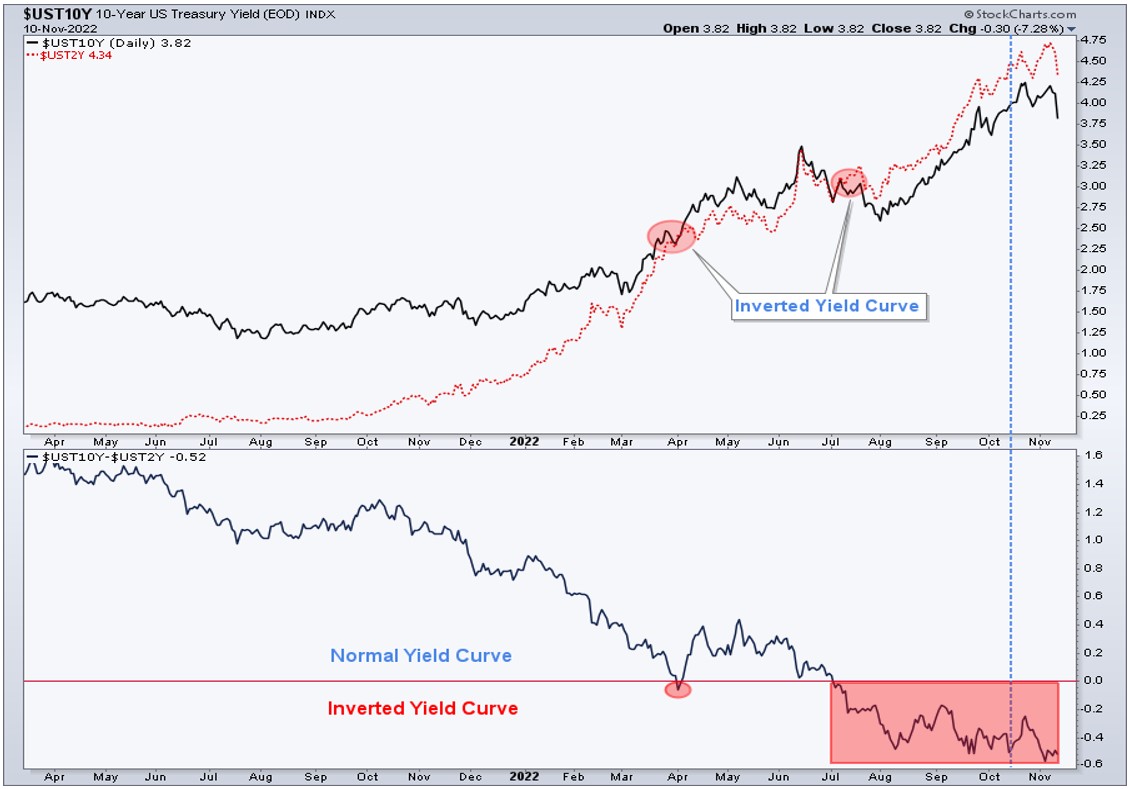
Additionally, the critical spread between the 2-year and the 10-year US Treasuries (chart 3) narrowed from -0.52 bp at the beginning of the trading session to -0.47 bp during the early afternoon to finish back where it was, -0.52 bp. This means that short-term Treasuries are yielding more than long-term treasuries. The significance of this yield inversion is in anticipation of an economic recession. In other words, most likely today, bond investors did not buy into the idea that the FED can slow down the pace of interest rate increases and the economy remains at risk of recession.
Chart 3
Signs of inflation improvement in the October CPI distracted investors from strong price pressures in areas like housing and food. The inflation report builds investors’ expectations for the December Federal Open Market Committee (FOMC – the FED) meeting hopefully at 50bp, for now. Chairman Powell’s message last week was that the tightening pace is less important than how high the fed funds rate can go. While this report shows some signs of progress on the inflation front, there will need to be persistent improvements in inflation for the FED to believe interest rates are sufficiently restrictive.
It was the reading of the October 2021 CPI that helped the Fed pivot towards seeing inflation as no longer transitory. A year later, year-on-year inflation is 7.7% and core inflation is 6.3%. Supply chains have finally shown significant signs of improvement. But now, service prices like housing and other wage-driven components are keeping inflation stubbornly high. The FED still has a long way to go before it can be confident price stability has been restored and its inflation target (2%) is at sight.
Interestingly enough, oil (WTIC) did not take part in today’s significant rally.
Check the Main Trend of stock indices, volatility, yield, currencies, and much more here.
Consider not being fully invested, taking on smaller position sizes, and holding a higher allocation of cash.
(*) The Greenwich Creek Capital “Index Trend Table” is not meant to be used in isolation, it is part of a more complex set of variables and it is not designed to provide trade entry and exit points.
Do you have a risk management strategy and a proven repetitive investment process to profit in bull markets and protect capital in bear markets? Check our website for more information about how we manage investment portfolios:
www.GreenwichCreekCapital.com
For High Net Worth Portfolios
And
www.FreedomInvest.com
The Active Asset Management Platform for Small Accounts.


