
Unfortunately, the prevailing forces in the stock market are not supporting the bullish case yet. The environment dominating the stock market continues to be led by U.S. Dollar strength, U.S. Treasury Yields holding up or even moving higher, and last but not least, the dominant force and “Main Trend” @GCCM of the S&P 500 continues to be bearish. In a nutshell: U.S. Dollar bullish + U.S. Treasury Yields bullish = stock market down and inflation is still a problem.
The above environment defines the last part of the economic cycle, Phase 4, in which inflation remains strong or even accelerates, GDP contracts, and all asset prices collapse due to high positive correlations between them. In terms of investments, the result is that there is nowhere to hide other than the U.S. Dollar and now, T-Bills which were not an option due to lack of yield not too long ago. The fight against inflation pushed up short-term yields substantially higher and made the yield of T-Bills attractive to park cash money and protect capital.
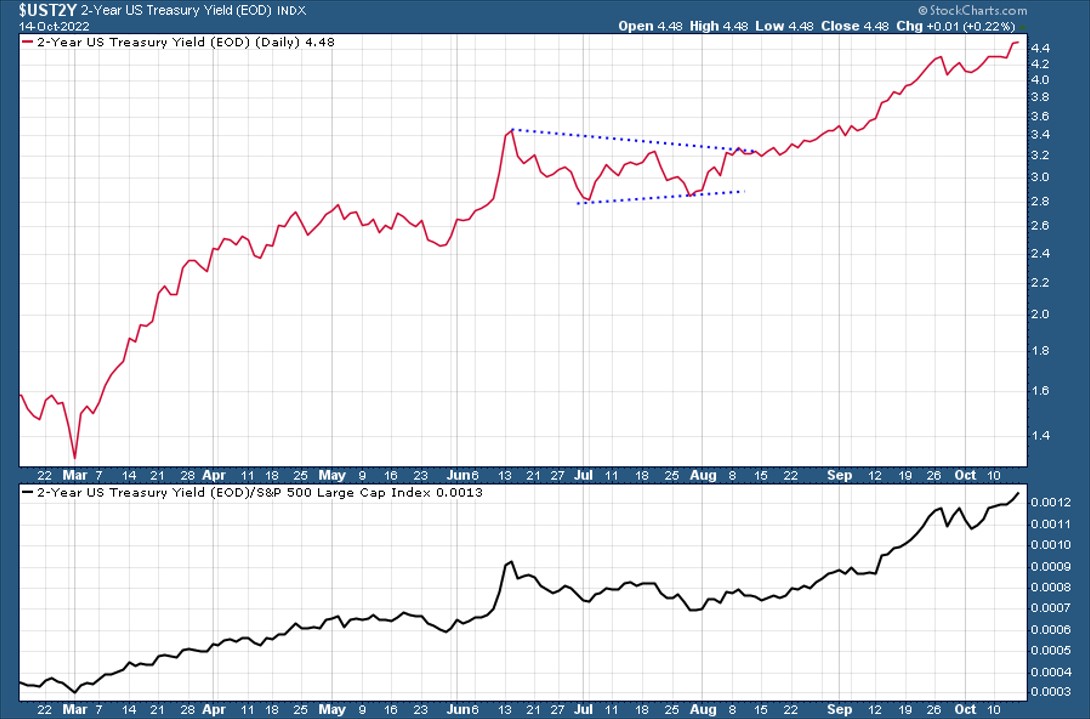
Chart 1 shows the 2 Year Treasury Yield at 4.48% on Friday and on a strong uptrend. The window below shows the same 2 Year Treasury Yield relative to the S&P 500 Index. The fact that the line is moving up shows more demand for the 2 Year Treasury than the stock index. In other words, if institutional money starts rotating out of stocks and into Treasuries, then we may assume that we have not seen the bottom of the stock market yet.
Chart 1
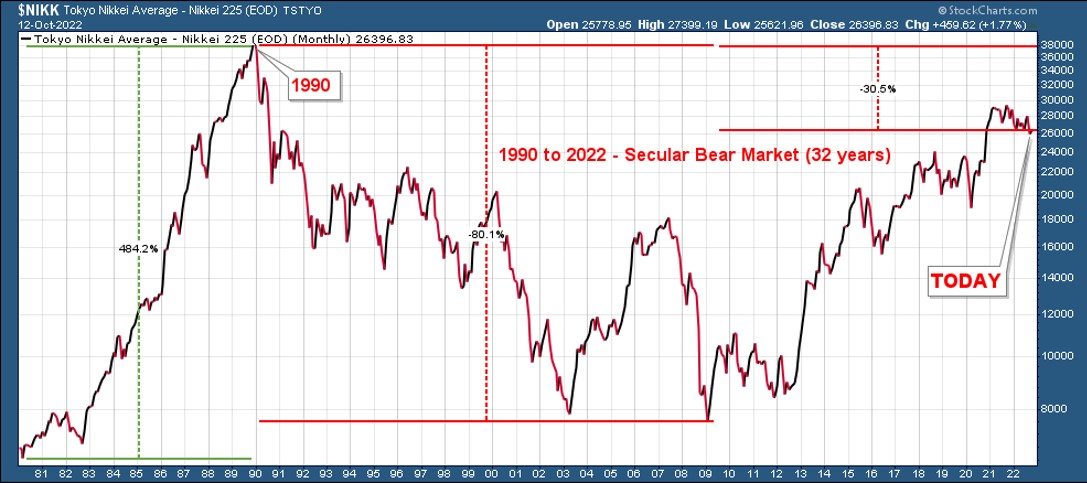
In this type of highly correlated and negative environment for investments, the big question is for how long this environment will remain in place. The answer is no one knows. Therefore, the need to protect capital while losses are still manageable. For those “long-term investors” who argue against aggressive defensive strategies such as raising the allocation of cash (including T-Bills) to avoid “timing the market,” let me remind you that the Nikkei 225 (Tokyo Nikkei Average $NIKK) reached its peak in 1990. Today, 32 years later, the index is still -30% below the 1990 level (Chart 2). My point is that there should be no excuses for not increasing the portfolio’s defensive positioning when its net asset value is not under your control if the portfolio remains fully invested. On the contrary, if you remain fully invested, non-elected bureaucrats at the helm of the central bank are in charge of YOUR money.
Chart 2
Copper (CPER), Base Metals (DBB), Industrials (XLI), and Transports ($TRAN) are on bearish downtrends. Agricultural Commodities (DBA) is also on a downtrend but holding up better than DBB. Energy (XLE) and Oil ($WTIC) are on downtrends too but fighting resistance lines as opposed to holding support lines like CPER, DBB, XLI, and $TRAN.
Additionally, the S&P 500 Index ($SPX) is on a bearish downtrend on increasing volume, while volatility ($VIX) continues to build higher lows and higher highs and remains comfortably above 30 (Chart 3). This is a precondition for a bear market to evolve. In the meantime, the S&P 500 seems to be ready to test its 3500 level, a key support area for many.
Chart 3
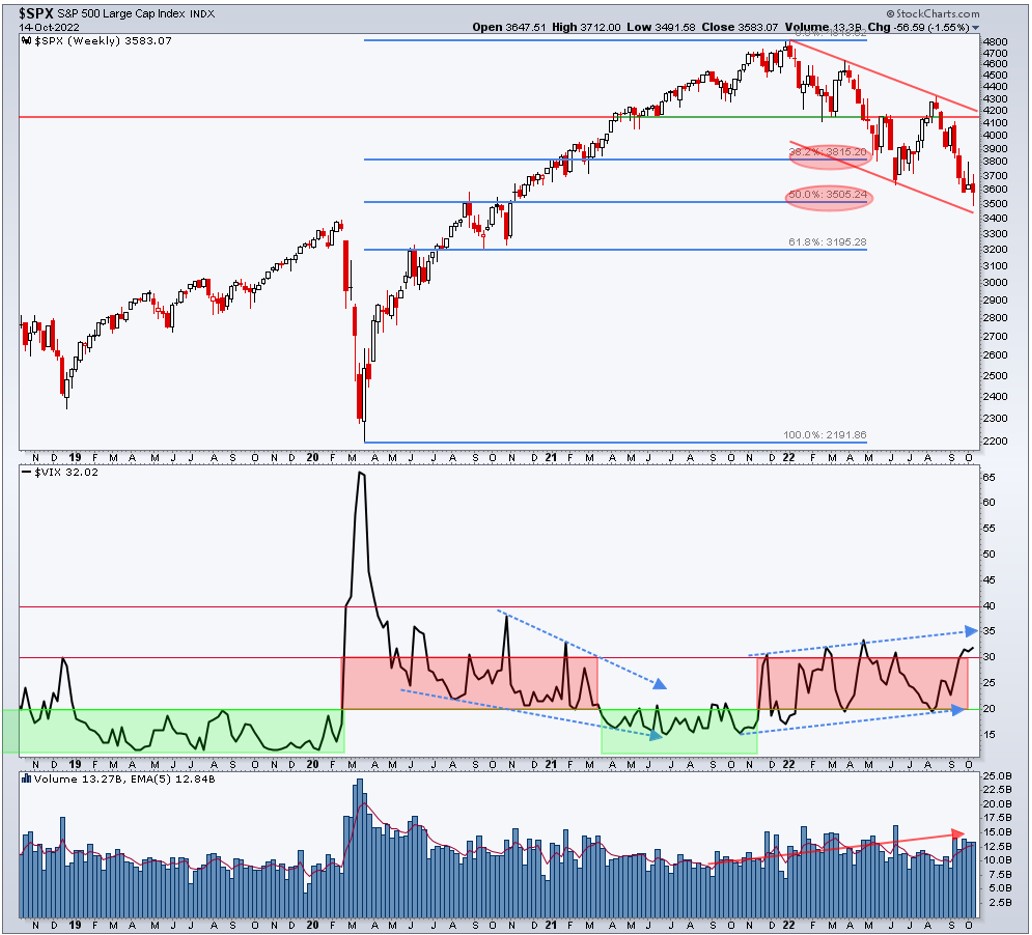
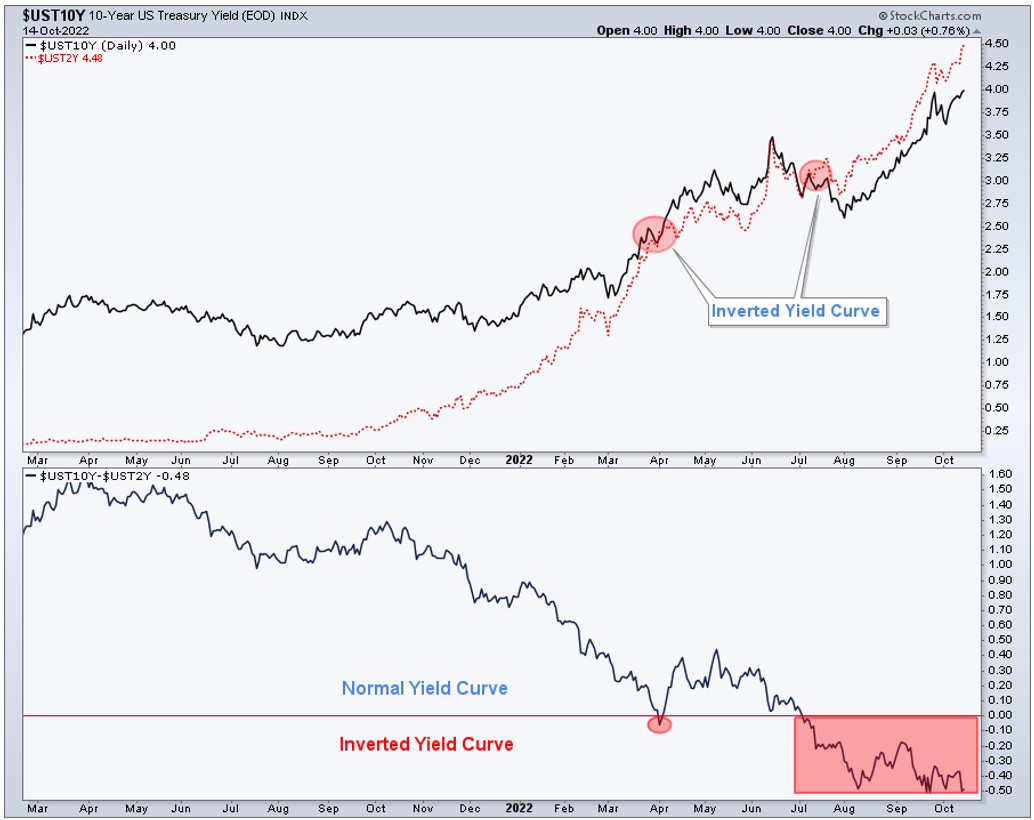
Chart 4 shows the yield of the 10-Year and 2-Year Treasury. The red dotted line is the 2 Year at 4.48% and the solid black line is the 10 Year at 4.00% on Friday 14. The window below shows the spread between these two Treasury Yields at -48 basis points. To put it into perspective, we’ve seen this type of inversion before the internet bubble. I am not predicting that history will repeat itself, but it is always good to have a clear understanding of the potential risk ahead of us. It is also clear on the chart that yield continues to be on a strong uptrend, which suggests that the fight against inflation is far from over. Certainly, this is not good for stocks.
Chart 4
The Federal Reserve’s (FED) balance sheet continues to contract. We understand why the FED is on a mission to withdraw QE from the market, but in our opinion, a soft landing of the U.S. economy is almost impossible in this kind of environment. On the contrary, if this trend continues, I would argue that the contraction of the FED’s balance sheet + hiking of interest rates = the perfect storm for financial markets.
Conclusion: Credit spread continues to show stress in the fixed-income market. This trend will be difficult to revert as the FED continues to shrink its balance sheet. The U.S. Dollar and Treasury Yields continue on strong uptrends, while the Main Trend of stock indices in the US remains bearish.
Risk: Long-lasting recession due to FED’s inability to timely manage inflation in combination with the government’s insatiable thirst to print money, which does not help to control inflation.
Check the Main Trend of stock indices, volatility, yield, currencies, and much more here.
Consider not being fully invested, taking on smaller position sizes, and holding a higher allocation of cash.
(*) The Greenwich Creek Capital “Index Trend Table” is not meant to be used in isolation, it is part of a more complex set of variables and it is not designed to provide trade entry and exit points.
Do you have a risk management strategy and a proven repetitive investment process to profit in bull markets and protect capital in bear markets? Check our website for more information about how we manage investment portfolios:
www.GreenwichCreekCapital.com
For High Net Worth Portfolios
And
www.FreedomInvest.com
The Active Asset Management Platform for Small Accounts.


