
At the end of my last article on September 1, 2023, my conclusion was: “Unemployment may start rising from here; the yield curve, which remains inverted where short-term rates are higher than mid and long-term rates, should start flattening, and stock market valuations should adjust down to the reality of an economic recession. This should be the final adjustment of the financial cycle, providing a clean slate to start a new, healthy economic cycle. And this should be the right time to start adding risk to portfolios.” This conclusion is still valid. The yield curve is substantially less inverted than 30 days ago. In mid-September, the inversion was about -0.76; today, it is -0.46, which is far from flat but moving in the right direction. By “new healthy cycle,” I mean a new period of accelerating growth with no inflation threats. The big question is, when will the new economic cycle begin? One probable scenario is that the stock market must undergo another correction period before entering the new economic cycle. In this article, I’m going to try to explain why.
In my opinion, financial market analysis must include a thorough understanding of four variables: Fundamental, technical, macro, and behavioral analysis.
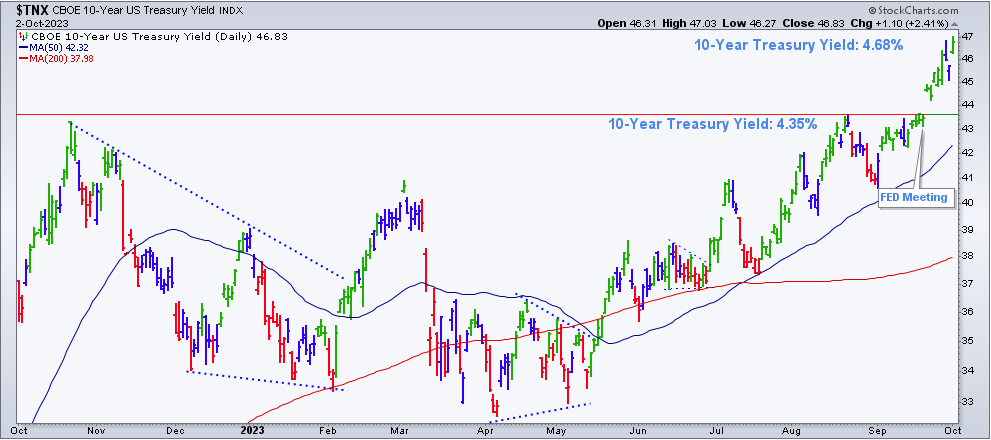
Fundamental: The fundamentals of the world economy continue to weaken while inflation is still a threat. In the U.S. economy, this is well manifested by the inversion of the yield curve and the uptrend in Treasury yields. On September 20, the Federal Reserve left rates unchanged with a hawkish bias, meaning that more increases should be expected. The next day, the 10-year Treasury yield broke above its resistance level. This move by bond traders and investors clearly suggests that inflation is still a problem even though it has been cooling down during the summer months.
This is important because not every bear market creates an economic recession, but every economic recession creates a bear market. How do economic recessions start? Most of the time, due to increasing interest rates to fight inflation, which results from an uptrend in commodity prices, mainly energy and oil. By the way, energy is the top performer during the last phase of the economic cycle. The sector has been the best performer during the last week, last month, and last three months.
The price of copper is in a bearish trend. Usually, this is associated with the world economy slowing down. At the same time, commodity prices, including energy and oil, are on uptrends. Bond prices continue to drop while yields continue to climb. This is how bond investors react to inflation expectations. This is important because I did not find in recent history a period in which the above fundamentals, combined with higher interest rates, did not end in an economic recession.
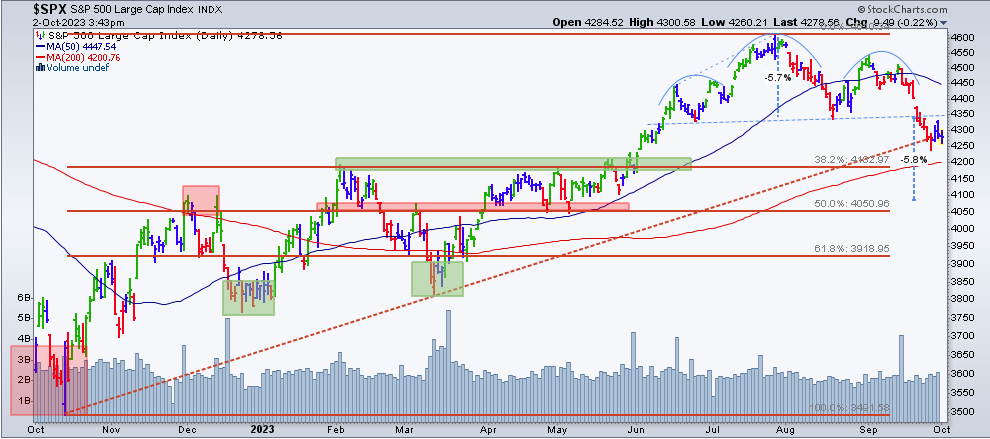
Technical: From a technical perspective, since its peak in late July or early August, the S&P 500 Index has been building lower highs and lower lows. This is the definition of a downtrend. For some technical analysts, the index is now dealing with a Head-and-Shoulders formation, which is a bearish development with the potential to drop another -5.8% from the breakdown at 4340. Therefore, the index could find support anywhere between 4050 to 4100. I must. admit that this technical formation does not work 100% of the time, but sometimes it does. Therefore, it should not be ignored. Additionally, 4050 would take the index to a 50% Fibonacci retracement from the uptrend that started in October 2022. This type of price retracement is absolutely normal in uptrends. It is a healthy way of decompressing the market and dealing with short-term volatility.
Macro: To understand Macro Analysis, one must understand the relationship between the different asset classes. There are four asset classes (stocks, bonds, commodities, and currencies), and all the securities within each asset class interact with each other. These relationships are not always constant. For example, bond and stock prices react similarly to inflation but react differently to GDP growth. There are books written about the subject. However, for the sake of keeping the article short, I am going to leave it here with no further explanation other than sharing the macro data I see every morning on my screen when I turn on my computers:
- S&P 500 Index: the short-term trend is bearish (bad for stocks)
- Bond prices: the short-term trend is bearish = higher yields (bad for stocks, mainly growth stocks)
- Commodity prices: the short-term trend is bullish (it is a sign of inflation)
- Oil (WTIC) prices: the short-term trend is bullish (it is also a sign of inflation)
- USD: the short-term trend is bullish, helped by a higher U.S. Treasury yield (bad for stocks in the U.S.)
- Volatility: it remains slightly below 20, which is positive for stocks, but the short-term trend is bullish, which is negative for stocks when it breaks above 20. At the time of this writing, volatility (VIX) stands at 17.60.
Behavioral: Even if volatility remains below 20, there are few stocks trading above their 50-day, 100-day, and 200-day moving averages, which means very little participation lately. Market indicators such as new highs and new lows show a lack of momentum in the stock market. Year-to-date, the performance of the S&P 500 Index is +11.68%, while the performance of the Equal Weight S&P 500 Index (RSP) is +1.69%. The difference between these two S&P 500 Indexes is that in the Equal Weight, all stocks in the index have the same weight and impact on performance, while the S&P 500 Index is a cap-weighted index. This means that large capitalization companies in the index have a bigger impact on its performance. This year, the index’s performance is undoubtedly due to a small group of mega-size companies. However, what if those strong performers catch down to the average S&P 500 stock instead of the average stock in the index catching up to the very few outperformers? Our risk management process includes monitoring these mega-size companies for signs of weakening momentum.
On the other hand, earnings season and seasonality are upon us. Q4 earnings could be the catalyst that moves the market in either direction. Also, the month of September is over. Historically, August/September is the worst period for the stock market. Although the overhang can extend to mid-October, historically, the best quarter of the year for stocks is the last quarter (Q4).
As I mentioned before, the leading sector for the month of September is energy (XLE), which is not good for stocks in general. However, short-term attempts of reversals are noticeable in growth sectors like communications (XLC), technology (XLK), and consumer discretionary (XLY). Regarding subsectors, the important semiconductors group seems to attempt a reversal of the downtrend that started in early August. This is important because these are the aggressive growth sectors of the economy and the natural leaders in a bull market. On the other hand, the most defensive sectors are showing signs of weakness, which helps the bull case.
The Bottom Line
Short-term is a split market, depending on what interest rates do. If they continue to rise, an economic recession will emerge sooner or later, and stock valuations will adjust down. In my opinion, this is the most probable outcome. However, this process can take months, and the stock market could go either way in the short term, helped by seasonality and earnings or dragged by the latter if they disappoint. It could turn around and rise or fall even further before moving higher. Therefore, focus on the evidence to position your portfolio, not on what you believe the stock market should do but on what it is actually doing. Also, have a proven risk management strategy in your toolbox; you may need one.
Check the Main Trend of stock indices, volatility, yield, currencies, and much more here.
Consider not being fully invested, taking on smaller position sizes, and holding a higher allocation of cash.
(*) The Greenwich Creek Capital “Index Trend Table” is not meant to be used in isolation, it is part of a more complex set of variables and it is not designed to provide trade entry and exit points.
Do you have a risk management strategy and a proven repetitive investment process to profit in bull markets and protect capital in bear markets? Check our website for more information about how we manage investment portfolios:
www.GreenwichCreekCapital.com
For High Net Worth Portfolios
And
www.FreedomInvest.com
The Active Asset Management Platform for Small Accounts.


