The purpose of this market update is to figure out whether the S&P500 is sustainable at current levels, or if the index is ready to roll over and collapse.
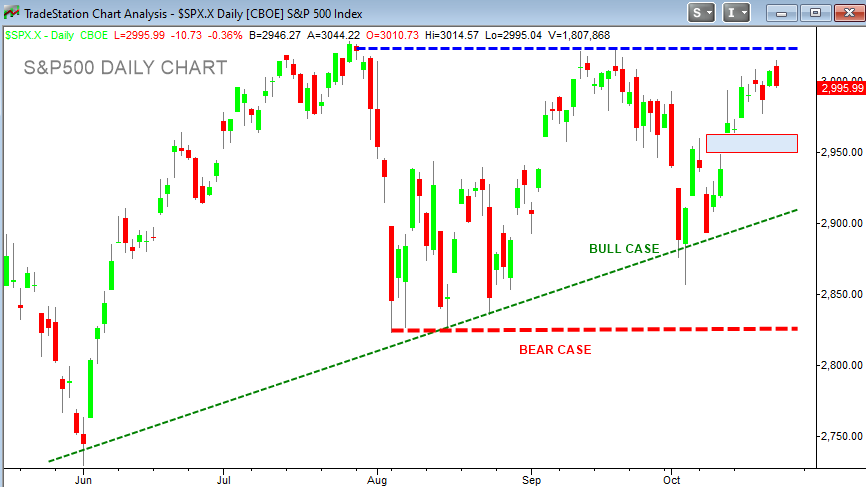
Well, the S&P500 Index is certainly closer to its all-time high than to its critical support level (see chart below). But by no means does this guarantee a continuation higher, although it does give us a bullish bias.
Remember, investing in the stock market is a game of probabilities. Trying to figure out the most likely scenario should help in determining where the S&P500 will go from here. If you are wrong in determining such scenario, you have to be nimble enough to adjust your forecast and risk management strategy to prevent losses.
The leading sectors of the S&P500 include three that are offensive in nature: Consumer Discretionary, Technology, and Financials. All three are in similar patterns and like the S&P500, closer to their all-time highs, than struggling to hold technical support levels. This is not bear market behavior. During a bear market, the opposite is usually true (defensive sectors lead). Although the industrial sector and communications are not as strong as technology, consumer discretionary, and financials, they are also far from their support levels. Let’s understand that “not as strong” is not necessarily weak or bearish. Furthermore, transports have lead an incredible rally since early October. According to Dow Theory, leadership from transportation confirms the bull market.
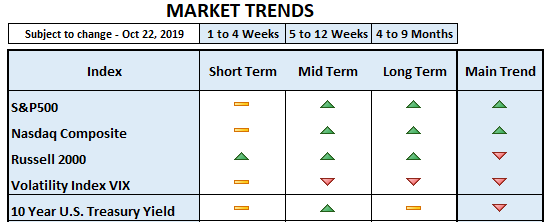
To further confirm the sector analysis we outlined above, we looked at the 10 Year US Treasury yield, which has moved higher since early October. A move like this is usually in anticipation of accelerating economic growth. The opposite is happening to the yield of US Treasury Bills, which are moving lower in sympathy with current Federal Reserve monetary policy. Note that Fed policy turned dovish in 2019 and just 2 weeks ago, the Fed expanded its balance sheet yet again, buying $60B worth of bonds in an effort to steepen the yield curve. We’ve seen the yield of short term maturities move lower, while the yield of longer maturities moved higher, indeed widening the spread of the yield curve. This is supportive of stronger economic growth.
We may argue that the S&P500 has moved nothing but sideways during the last 12 months, with no return. This, however, is typical of continuation patterns. Since the previous pattern was a leg up, most likely after the consolidation period ends, the next market move should be another leg up. This is in agreement with the “V-shaped” recovery of late December 2018. Usually peaks and bottoms are processes that take some time to develop, while market pullbacks can be sudden “V-shaped” moves, like the one we saw last year.
So far, we currently conclude that after a secular bear market, which began with the internet bubble and continued with the mortgage crisis, the S&P500 has entered into a secular (long term) bull market in which we shall see cyclical (short term) bear markets. The index may be concluding a cyclical bear market and getting ready to regain a new leg up. We believe monetary policy and a dovish Fed support this theory, too. As they say, “don’t fight the Fed.”
Despite underperformance in small-caps and mid-caps, in our opinion most of the weakness we saw has or is recovering and most of the evidence remains bullish for stocks. The lack of uptrend participation of these two groups is not necessarily an indication of a bear market in the making, unless the S&P500 and Nasdaq join in on the weakness.


