
On Thursday the stock market sold off in a pretty aggressive manner. According to headlines the reason behind the selloff, was a combination of fear of a second wave of Covid-19 and after Jerome Powell’s speech on Wednesday, that economic growth will not recover in a straight line. Really?
If the above statement is correct, then investors’ behavior is in fact irrational. In October 2017 Richard Thaler won the Nobel Prize in economics. According to his research, investors, even when they come together in large markets, exhibit the same kind of limited cognition, lack of self-control, and social preferences that consumers do—and therefore systematic inefficiencies can persist in markets without being arbitraged away. In other words, since people could be systematically wrong, markets could be systematically wrong as well.
The behavior of copper and the 10 year Treasury yield have been signaling economic uncertainty much earlier than Covid-19. In fact, since 2018.
The way I see it investors have been acting irrationally bullish since March 23rd when the stock market reached extremely oversold levels and consequently, they drove the same stock market to an extreme overbought condition that needed to be resolved.
The more practical point is a twofold: (i) where does the S&P 500 go from here and (ii) if it were to go down how to manage risk and the potential loss of capital?
In our previous Market Commentary on June 1st (Mapping the S&P 500 While Volatility Remains High) I mentioned that the main trends of the S&P 500 and the Nasdaq were not aligned in the same direction. While the latter was bullish the former was not. Nonetheless, the price of the S&P 500 continued up for a week or so barely moving into bullish territory for a couple of days, but losing the signal immediately with the price action from the 9th June forward.
Where does the S&P 500 go from here? It is anyone’s guess. In our view there are three main forces at play for each, bulls and bears.
Bull Case:
- The Federal Reserve and its massive monetary policy to improve liquidity.
- The fiscal policy implemented by the Treasury Department to support the economy.
- Sooner or later there will be a treatment and eventually a vaccine to control Covid-19. In our view it’s only a matter of time.
Bear Case:
- The duration and severity of the economic impact of a second and perhaps even a third wave of Covid-19 is unpredictable.
- The unintended consequence of excessive liquidity such as weak growth, poor productivity and low inflation (“Escape from Central Bank Trap” by economist and fund manager Daniel Lacalle).
- Massive printing of money can lead to stagflation (decelerating GDP growth due to Covid-19 and higher inflation due to excess printing of money).
We can debate at length about each of the points above without arriving to a verifiable conclusion. This is uncharted territory for both sides. But we are certain about point 3 in the bull case and we are also certain about points 2 and 3 in the bear case. We expect the next crisis to come from excess debt and deficit from both countries and corporations. A second and third wave of Covid-19 could speed up bankruptcies all over the world, not just in the US, for companies that perhaps would not be around if it wasn’t for too low interest rates for too long. We do not need to protect portfolios from the bull case but we should protect capital in the event the bear case prevails. Although we believe the S&P 500 and Nasdaq are in secular bull markets, the current cyclical bear market can spin out of control by accelerating a debt and deficit crisis that otherwise it would take longer to evolve. While pharmaceutical companies work on treatment and a vaccine to subdue Covid-19, a bigger crisis can trigger if at least a treatment is not found soon enough.
Mapping the Bear Case
Keep in mind that in bear markets support lines are usually broken.
First area of support: 3000 (yellow dotted line)
Second area of support: 2900 (pink dotted line)
Third area of support: 2836 (white dotted line)
Ideally to remain in uptrend the S&P 500 should not break down from the pink dotted line (2907). But even if it does, 2836 to 2766 should be an acceptable level for a rebound without losing the mid to long turn uptrend.
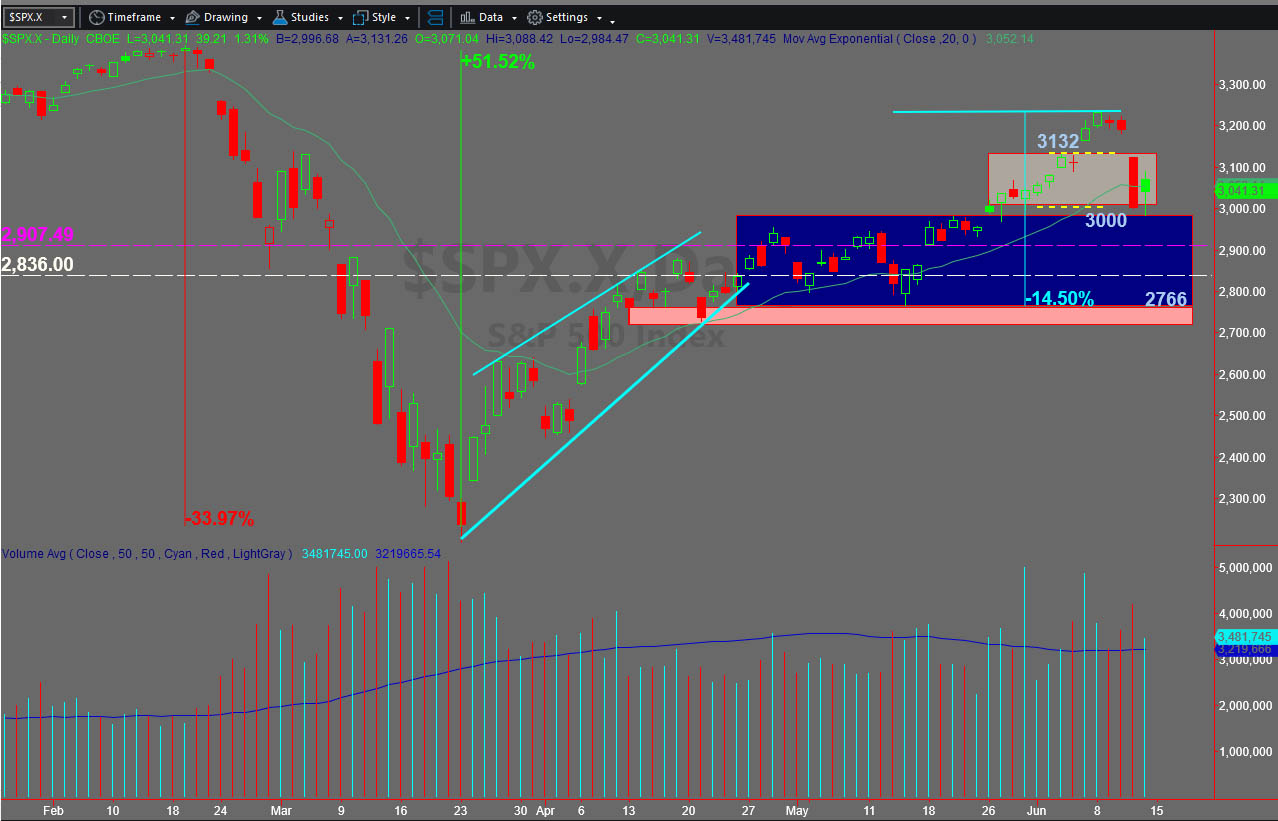
Chart provided by TradeStation
Do you have a risk management strategy and a proven repetitive investment process to profit in bull markets and protect capital in bear markets? Check our website for more information about how we manage investment portfolios:
www.GreenwichCreekCapital.com
For High Net Worth Portfolios
And
www.FreedomInvest.com
The Active Asset Management Platform for Small Accounts.


