
In our article on June 1st we described how we determine Market Trends and the different time frames or durations we look at to determine those trends. We wrote: “Currently the Short, Mid, Long and Main Trends of the Nasdaq are bullish. But the Main Trends of the S&P 500 Index, S&P 400 Mid Cap and Russell 2000 Small Cap remain bearish. If the market conditions continue to improve, the Main Trend of the S&P 500 may be able to change from bearish to bullish shortly because the Short, Mid and Long Term Trends are already bullish. If the Nasdaq and the S&P 500 were aligned in the same direction, buying a pullback would be an easy decision.” Currently, the Main Trend of both are in the same direction: Bullish. Thus, any selloff or pullback should be a buying opportunity, but not so fast. Do not buy while stocks continue to fall.
Short Term Volatility remains high, which is negative for stocks. On the other hand, the Main Trend of volatility is now slightly bearish alongside a bearish trend for the US dollar (USD). Both symptoms are good for stocks. A weaker USD makes US products more competitive in the international market, helping US companies. Volatility and stocks move in opposite directions most of the time. Thus, lower volatility should be beneficial for stocks.
Another consequence of a weaker USD is improving commodity prices. Copper broke out of a downtrend that started in mid-2011. The S&P Metals & Mining SPDR (XME) is also trying to break out of a downtrend that started in mid-2018. Yes, you may argue that gold is also on a bullish uptrend, which is correct. It is also true that high volatility with improving demand for gold makes a perfect fearful environment for financial markets. But gold also thrives when the USD moves down, like other commodities do and loves low interest rate environments, which we have now. According to the Federal Reserve (FED) itself, interest rates will remain low through 2023. This might be the cause of high demand for gold.
Additionally, silver also broke out of a downtrend that started in 2011 and a consolidation period that started in 2014. Silver is considered 50% industrial and 50% precious metal. The demand for industrial metals and copper should be positive for the global economy, helping the idea that the demand for gold is based on low yields and a weak USD.
Looking at the 10 year US Treasury Yield (TSY) after peaking in early May and reaching 0.95%, yield moved down to reach 0.5% in early August. By mid-August the 10 year TSY reached 0.74% and started a consolidation process fluctuating from 0.6% to 0.72%. Low yields and low mortgage rates are helping an already strong housing market, which helps the overall US economy in line with industrial metals and transportation. The latter challenging the highs of 2018 when earnings and sales for the S&P500 index peaked.
At the same time the stock market started to move down with improving volatility, but yields are not breaking down from support. This fact makes us believe that the selloff in stocks is temporary and due to a rebalance of demand for other sectors than just technology. If this is true, it should be good for a longer term bull market or continuation up. Keep in mind that after the leg up that started in March, the ignition and sustainability of the short term bull market has been fueled mostly by technology and growth stocks. It should be good news for the bull market to have broader participation instead of just growth and technology. In other words, the 10 year TSY consolidation and breakout (when and if) could be suggesting that a rebalancing of participation is taking place in the stock market.
In summary: our indicators are signaling short term volatility and further short term weakness in stocks. The problem with this picture is that political uncertainty, failure to pass the second stimulus assistance package to businesses and individuals and a second wave of Covid-19 could spiraled into a much more serious selloff and eventually, trigger another cyclical bear market. An early indication that this scenario may happen would be USD strength and 10 year TSY breaking down. Therefore, a solid risk management strategy is encouraged to navigate the next few weeks and perhaps beyond, but for now our data indicates that the secular (long term) bull market continues. Remember that our conclusions and Market Trends are all data driven. It is not emotions or gut feeling, it is data. Therefore, as the data changes our outlook also changes.
Target 10 year TSY ($TNX.X): 0.76% to 0.78% – Indicated with a blue rectangle. If yields move up, bonds selloff and most likely money rotates into equities.
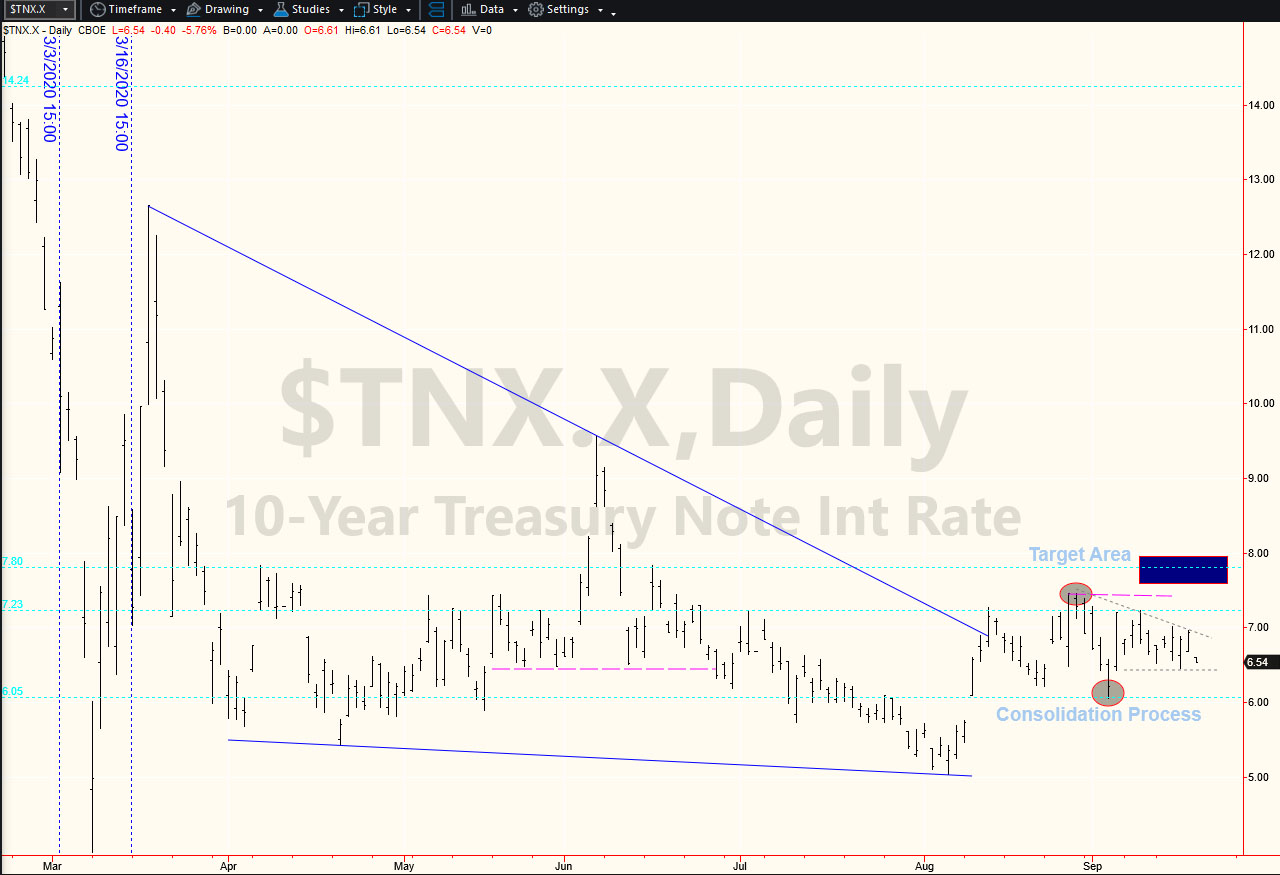
Chart provided by TradeStation
Short Term Target Area for SPY (S&P500 ETF): 320 to 310 then 300 to 290
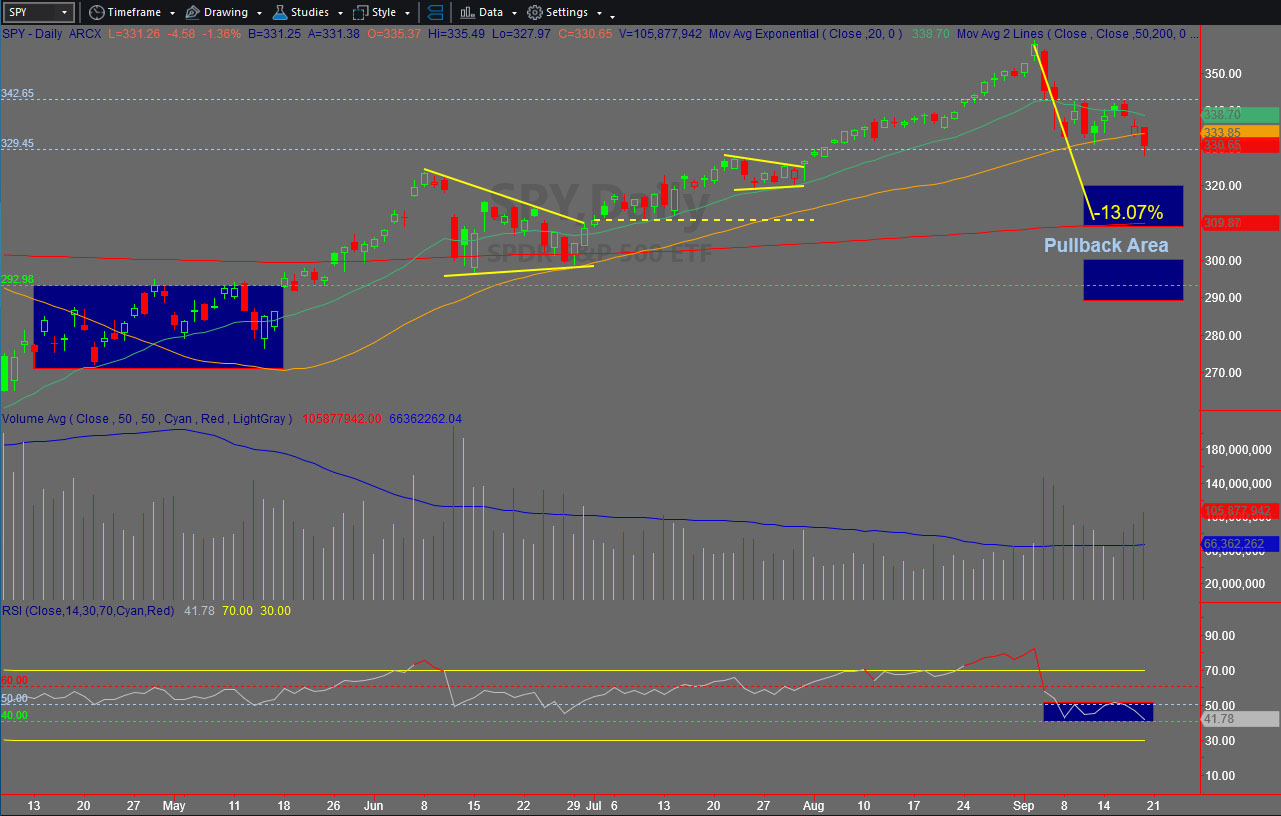
Chart provided by TradeStation
Short Term Target Area for QQQ (Nasdaq ETF): 250 to 240
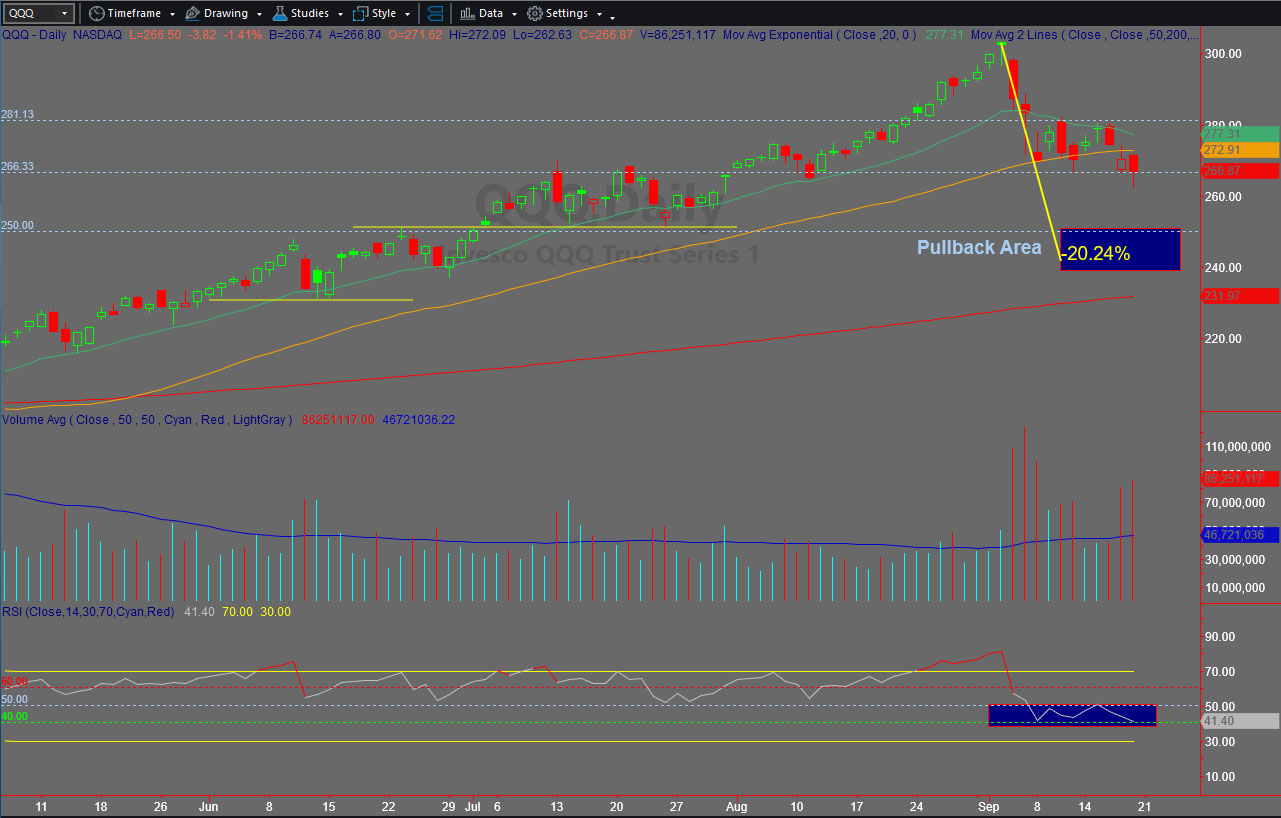
Chart provided by TradeStation
Do you have a risk management strategy and a proven repetitive investment process to profit in bull markets and protect capital in bear markets? Check our website for more information about how we manage investment portfolios:
www.GreenwichCreekCapital.com | For High Net Worth Portfolios
and www.FreedomInvest.com | The Active Asset Management Platform for Small Accounts.


