
Although experiencing some volatility, defensive sectors of the S&P 500 Index held up fairly well during the first quarter of the year to finally weaken in the second quarter. The same applies to commodities, including agricultural commodities and industrial metals. Even oil succumbed under strong selling pressure. A strong U.S. dollar continues to be the only place to hide. Coincidently, since the interest rate hike on June 15th, the bond market seems to be more concerned about economic recession than inflation.
Copper dropped about -30% since its peak in early March and lumber about -47% since its peak in early January. Copper is 100% industrial and lumber prices have a big impact on construction. Is it possible that the bond market is right in being more concerned about economic recession, while the Federal Reserve (FED) continues to focus on inflation? If the bond market is in fact right, there will be no soft landing for the U.S. economy because the FED will continue to hike rates in an economy that is already slowing down.
Perhaps the above is overshadowing the few positives we have recently noticed in equity markets, such as the relative outperformance of growth versus value. The fact is that at the end of the economic cycle nothing works. All asset classes move down under strong selling pressure while the U.S. dollar remains strong alongside gold, which is not happening for gold this time around. At least not yet. In such an environment, long-term Treasury yields move lower even as the FED hikes rates, and the yield curve becomes inverted in anticipation of an economic recession. This is exactly where financial markets are right now and it is exactly what happened before every recession the economy experienced since 1970.
Maybe growth stocks outperforming their value peers is an anticipation of a bottoming process that has already begun. I’ve seen it in the past and it is a positive sign, but keep in mind that even in an environment in which investors are beginning to accumulate inexpensive growth stocks, the stock market can continue further down. Then the question is for how long and how much further? No one knows. Our quantitative model signals that the S&P 500 Index and many other indices remain in a bear market. Check our updated “Index Trend Table” here. This quantitative model prevented us from losing capital during the Internet Bubble (2001 – 2003), Mortgage Crisis (2007 – 2009), and every stock market correction and bear market ever since. Not bad!
In Summary:
- Our quantitative model remains bearish
- Participation of stocks in rallies remains very low
- The “Main Trend” of gold is now bearish
- Commodities in general, including agricultural and industrial metals are under strong selling pressure
- The “Main Trend” of oil remains bullish but is breaking down
- BBB and CCC credit spreads reached new highs again
- U.S Dollar continues to surge and remains on a strong bullish uptrend
- Treasury yields started to move down
- Volatility remains unchanged, S&P 500 moves up in price on lower volume: this combination is known as a Head-Fake and usually it is followed by another drop in stock market prices. Whether or not this time the prophecy is fulfilled, remains to be seen.
- Currently the S&P 500 is at the top or near the top of its trading range, while volatility (VIX) closed on Friday at the bottom of its trading range. Usually, in bear markets, this combination is followed by a selloff in stocks.
The following are the updated S&P 500 Index daily chart and the 10 Year Treasury Yield (chart 2) included in the last Market Commentary on June 3, 2022. The S&P 500 chart shows the resistance area on June 3 (green rectangle) and the likely direction back then marked by a red rectangle. Unfortunately, we were right and the stock market moved down. The yellow rectangle indicates the present resistance area encountered by the index. In order for the index to continue its move up, it must break and close above 3910 through 3974.
Chart 1
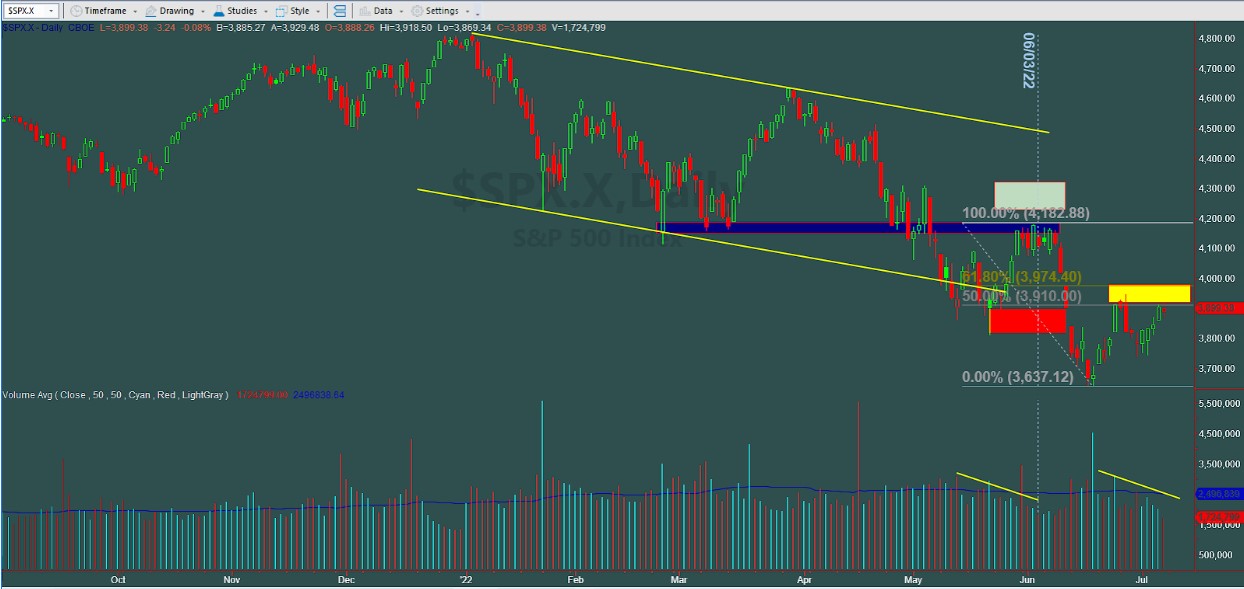
Chart provided by TradeStation
Note on chart 2 how the yield of the 10 Year Treasury started to drop on the same day the FED hiked rates by 75 basis points. It is difficult to say if this trend will continue down. If it does, it would be a clear indication that the bond market is more concerned about recession than inflation. Either way, the conclusion is that the current scenario does not seem to be stock-friendly yet.
Chart 2
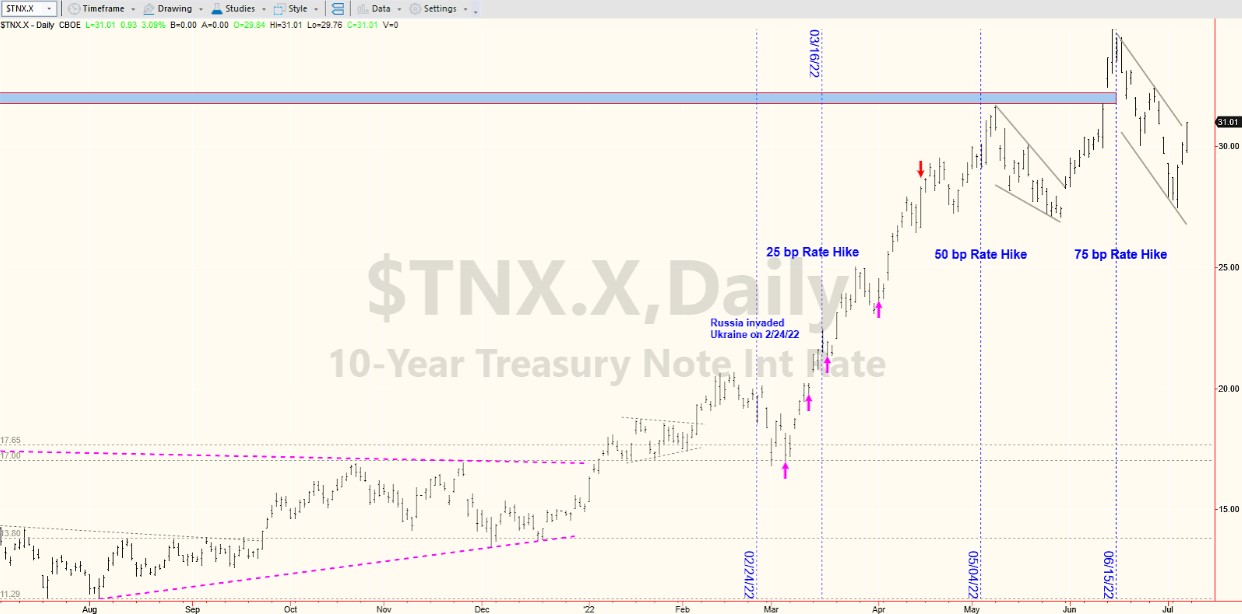
Chart provided by TradeStation
(*) The Greenwich Creek Capital “Index Trend Table” is not meant to be used in isolation, it is part of a more complex set of variables and it is not designed to provide trade entry and exit points.
Do you have a risk management strategy and a proven repetitive investment process to profit in bull markets and protect capital in bear markets? Check our website for more information about how we manage investment portfolios:
www.GreenwichCreekCapital.com
For High Net Worth Portfolios
And
www.FreedomInvest.com
The Active Asset Management Platform for Small Accounts.


