
A retest of the February lows seems likely! And necessary.
What makes us believe that it is possible? (i) U.S. Treasury Yields refused to move up even when the stock market rallied after the selloff on February 28th. (ii) Gold sold off on the 28th, but rallied alongside the stock market right after the selloff. (iii) Volatility remains too high.
In our last article dated February 28th, we concluded that in bull markets, a 50% retracement of the last leg up is possible and even normal. That retracement level for the S&P500 Index is 2870 (green dotted line on the chart below and a -15.3% drop from its previous high). At the time of this writing, we are not there yet.
We also mentioned that a test of the lows of February 28th is likely and perhaps even necessary. For the stock market to start building a reversal, it first needs to consolidate and build a bottom. This bottoming process may take even a few weeks. A double bottom, which would be formed with a test of the February 28th low, could be the beginning of the bottoming process.
At the time of this writing, relative strength on the S&P500 and Nasdaq is better than what it was on February 28th, which may suggest a bit of strength for a move up, if some optimism arises. In other words, even if there is another selloff to test the lows of February 28th, there are also some indicators that suggest another possible short-term rebound. If this happens, it would most likely confirm the inception of the bottoming process.
Also, we’ve seen a historical move down in yields all along the U.S. Treasury yield curve, which is definitely a move into safety and an aversion to risk. However, the yield curve is not inverted and remains steep. An inverted yield curve is an anticipation of an economic slowdown or recession. The opposite is true when the curve is steep. It doesn’t seem to us that bond investors are anticipating a collapse of the U.S. economy, not even due to Coronavirus (at least not yet). Regardless, there is no doubt in our minds that volatility may remain high and the start of a bottoming process may take a while to form.
What’s the other scenario? Prices pierce through both 2870 and 2855. In that case, our next area of support for the S&P500 is ~2745, a drop of ~-19% from recent highs (pink dotted line). This may well be the case in the short term. If any of these levels are reached, it will be important that intraday prices rebound with above average volume and close at the top of the daily range for a reversal to have a chance to succeed.
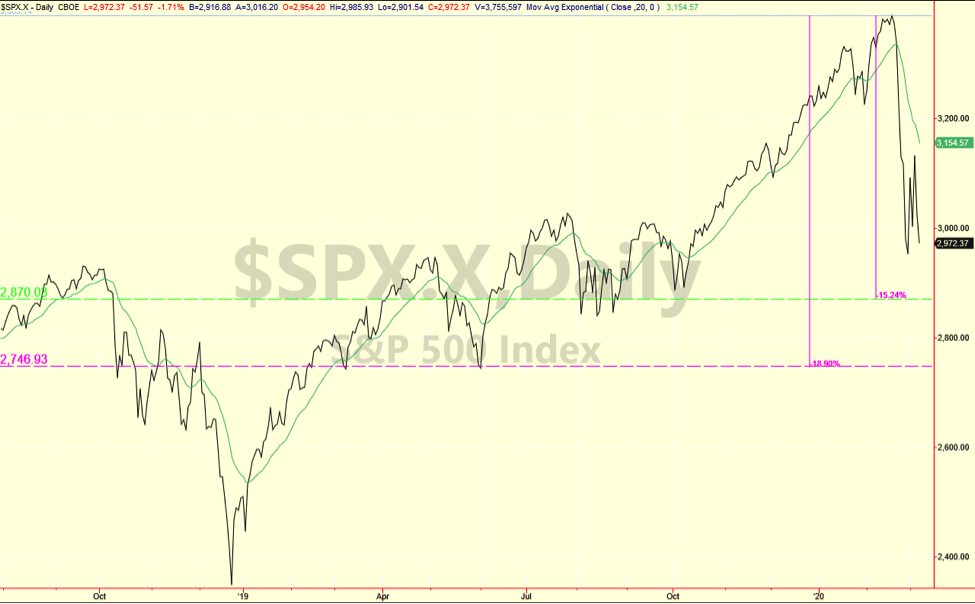
Chart provided by TradeStation


