
Let me start by summarizing the short term market action. Then, we’ll dive into the longer term and the economic and political forces that might move the market in the 1st and 2nd Quarter 2020.
Our experience is that in order to effectively figure out stock, bond, and commodity markets and even individual securities, they must be analyzed in different time frames. We look at the short, mid and long term trends combined with other variables in order to figure out the main trend.
In 2019, the stock and bond markets have been driven by monetary policy (low rates and a dovish Federal Reserve (Fed)) and the trade dispute between the U.S. and China. All this only adds volatility to the stock market, while the U.S. economy continues to slow down as the data shows. Friday’s strong unemployment rate (a drop to 3.5% from 3.6%) may give the Fed an excuse to stop cutting rates and even worse, change their rhetoric to a somehow hawkish stance. This and an extended trade dispute with China, which is possible, would continue to add volatility to stock markets.
Although the 10 year US Treasury yield bottomed at 1.43% in early September, it is currently at ~1.82%. Since then, the 10 year yield has been building higher highs and higher lows, which defines an uptrend (chart 1). Usually this kind of move takes place in anticipation of future improvement in economic growth, which so far doesn’t seem to be happening yet, regardless of today’s strong 3.5% unemployment rate. Keep in mind that the unemployment rate is a lagging indicator of economic growth.
The behavior of the 10 year Treasury yield suggests that a test of resistance at 1.97% is possible (chart 1). We see the current trading range between 1.67% and 1.97%. If there is no break out above 1.97%, it would make sense to add mid to long term maturities, in anticipation of the next move down in yield, which may create weakness in equity markets. On the other hand, a sustainable breakout of 1.97% would be very bullish for stocks. In this scenario, short to mid-term duration bonds and a heavier equity position makes more sense.
The behavior of gold and copper seem to be validating the latter investment scenario. These two metals have been showing an inverse relationship since early 2019. At the time the 10 year Treasury yield moved lower in anticipation of a global economic slowdown, an inverted yield curve was formed, gold moved up and copper moved down. As mentioned before, since September, the 10 year Treasury yield has been moving up with copper, while gold changed direction and is moving lower. The fact that the 10 year Treasury yield and copper are moving higher is in line with a normal yield curve. This move may be in anticipation of improving global growth in 2020 and certainly, it would be very bullish for stocks. Keep in mind that while gold is purely a defensive investment play, copper is 100% economic and offensive.
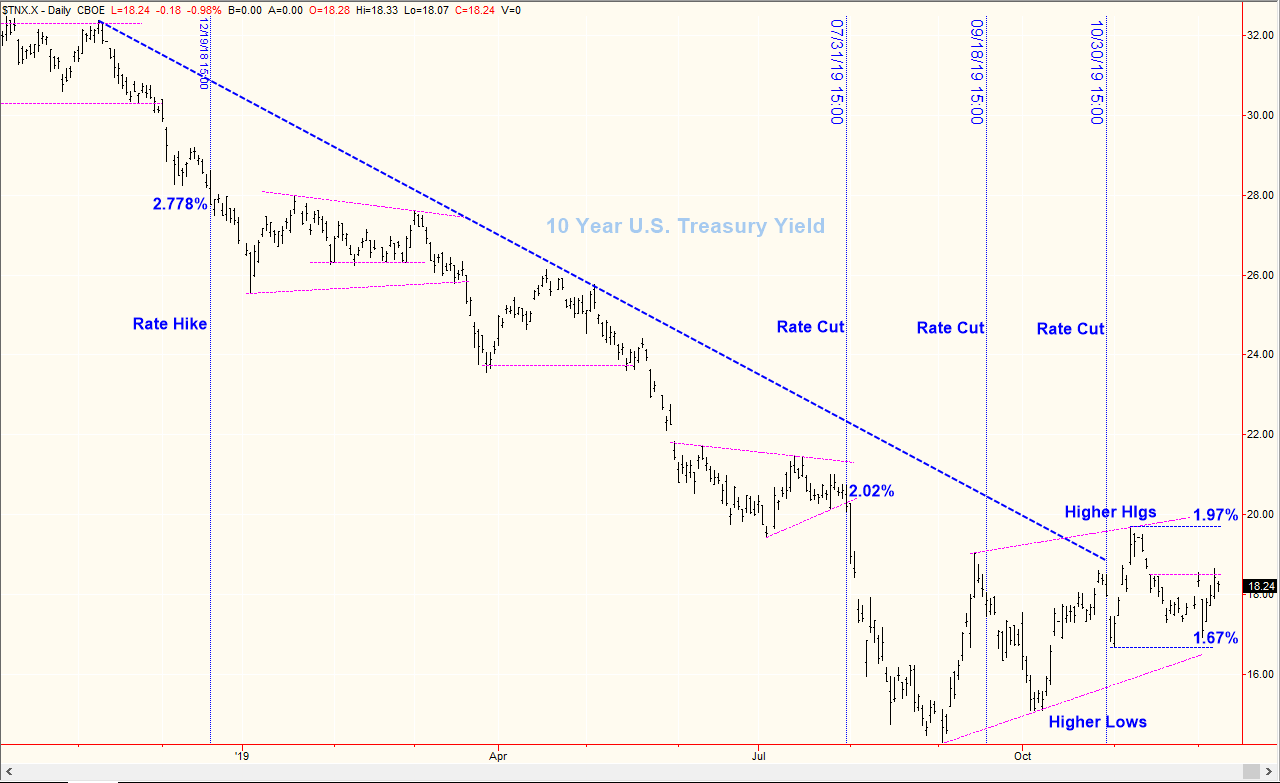
Chart 1 – provided by TradeStation
From a business management point of view, although the consumer seems healthy, business leaders seem to be taking a very prudent stance in terms of investments (capital expenditures). This may be partially because of the uncertainty surrounding the November 2020 presidential election. With a pro-business administration led by a controversial president and the opposition’s very radical socialist agenda, business leaders are taking a very conservative stance in terms of how they spend and invest capital. This, in turn, typically does not help economic growth. To keep the economy going and favor re-election, we would expect the current administration to implement an infrastructure spending plan, which would benefit both parties. This would also be good for stocks.
Let’s dig in to the economic data…
ISM Manufacturing is contracting, GDP is slowing down and ISM Services continues to slow down, (although not contracting yet). In our opinion, the US economy is in a late stage cycle. In a late stage cycle, first, economic growth slows down and inflation increases, and then both, economic growth and inflation drop together. At this stage of the cycle is when the stock market typically collapses and the main profitable investment in town should be US Treasury bonds. Thus, forecasting the next market move is extremely important.
Short term, the uptrend of the S&P 500 Index remains intact, regardless of last week’s early selloff. Our near term support is between 3050 and 3030 with a potential retracement back down to 3000. Mid-term and long term trends remain bullish (chart 2).
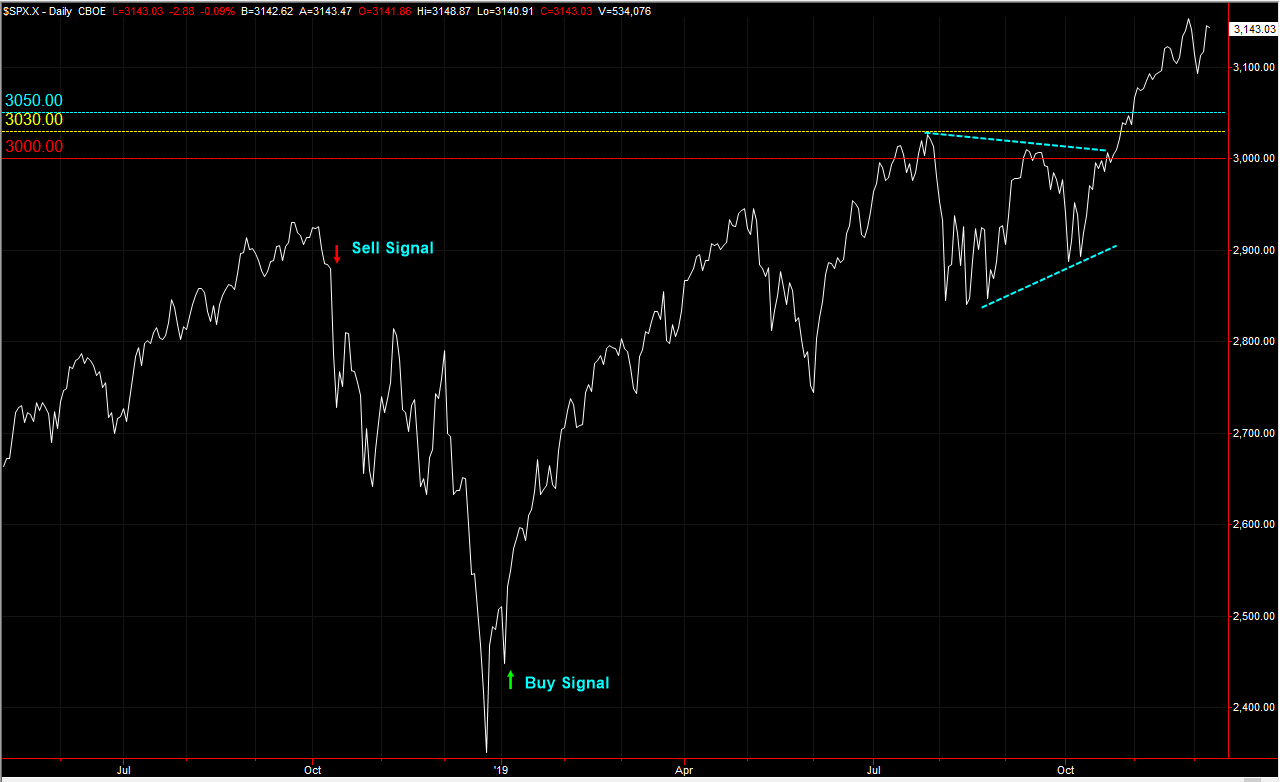
Chart 2 – provided by TradeStation
Corporate earnings and sales peaked in the 3rd Quarter 2018 and the stock market had a negative performance for the same year. During 2019, GDP has continued to slow down and corporate earnings and sales have contracted, even moving into negative territory in some cases. The stock market continues to move higher.
2018’s negative stock market performance was mainly due to an out-of-touch, reactive Fed increasing rates at the time the economy had started to slow down on its own. The main reason for positive stock market performance this year has been a more dovish, accommodative, and proactive Fed. In 2019, the Fed lowered rates three times, instead of increasing three times (their initial trajectory).
Bottom Line: There are many different variables, only a handful of them mentioned above, that may affect how the Fed perceives the economy and implements monetary policy. For now, we remain bullish on the S&P 500. We remain cautiously prudent, however, because the symptoms of the economy are those of a late cycle weakening economy, rather than the beginning of an early growing cycle. We expect those symptoms of slow growth and low inflation to remain for the first two quarters of 2020 and continue navigating the late cycle economy. The key here is that the Fed should remain dovish to prevent the real economy and financial markets from collapsing. Will they?


