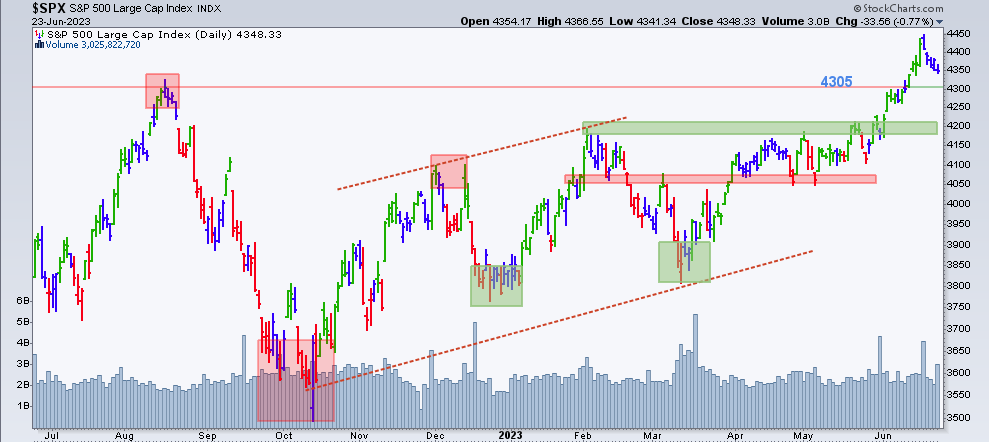
The S&P 500 Index broke above the 4305 level mentioned in our last article. That is good for stocks and supports the bull case, but the index moved into overbought territory and needs to cool down. After a steep move up like the one seen from late May to mid-June, it is normal to expect a pullback to previous resistance levels, in this case, 4305 would be the first support, and 4180 to 4200 would be the second support for the index.
Chart 1
This is a market that should be treated prudently and with respect. You may argue that there is evidence the bull market has resumed, but there is also evidence of a looming recession, and the Federal Reserve (FED) is not yet done hiking rates.
The stock market’s current condition reminds me of the same scenario before the internet bubble, a big rally before a big collapse. Back then, we had an inverted yield curve announcing an economic recession, which Wall Street firms decided to ignore. We call it the Internet Bubble, but it wasn’t high stock valuations that took the market down, it was the reality of a recession that hit investors.
The collapse of Silicon Valley Bank, like the collapse of the hedge fund Long Term Capital Management (LTCM) in 1998, triggered FED’s easing and liquidity deployed into the new secular growth theme of Artificial Intelligence (AI), very much like the LTCM collapse deployed Fed’s easing and liquidity into the new secular growth theme of the internet back then.
On Wednesday 14th the FED clearly communicated that the fed-funds rate needs to reach 6% to crack down on inflation. Thus, investors expect the FED to hike rates anywhere from 75 bp to 100 bp before the end of the year. If rates are now at 5% to 5.25%, an increase of that magnitude will bring the fed-funds rate to 6% or above. In addition, the narrative of the FED has not changed, they are committed to taking inflation back to 2%.
History seems to be repeating itself: if we are going to experience another leg down, it won’t be because of an overbought stock market or valuations or higher rates, because all these variables are well-known to investors. It will be the reality of an economic recession, which has been announced by the bond market since July 2022. The inversion of the yield curve is back to -97 bp, which is about double the inversion before the internet bubble.
If I’m wrong and history does not repeat this time, I have to prudently and gradually add risk to portfolios to participate in the upside, mainly because our quant is bullish. But I would be a complete fool if I, like many before the collapse in 2000, ignore the red flag being raised by the yield curve. And this is where real “Risk Management” comes into place. Participate in the uptrend but remain diligent and have a proven plan to take risks off portfolios if necessary.
Stock participation has been widening up to Friday 16th, before the selloff, which is positive to see other areas of the stock market performing well, but this is still a stock market driven by very few names in two sectors. Therefore, the real question is when will the leading names in Technology and Communication Services take a rest from an incredible 2023 run?
Some stocks are now showing patterns similar to previous market tops. Within Technology, Semiconductors have been one of the strongest since the beginning of the year. Two leading stocks have been Advanced Micro Devices, Inc. (AMD) and Nvidia Corp. (NVDA), showing possible uptrend exhaustion by printing bearish divergence between price action and momentum. It is like temporarily running out of gas to allow the stocks to cool down after an intense rally. Admittedly, other stocks like Apple, Inc. (AAPL) keep pushing higher on stronger momentum. Perhaps looking for the strongest price charts to struggle is the signal that the uptrend and momentum in technology are abating.
Conclusion:
The labor market is still tight, more jobs and higher wages support consumer spending, which continues to increase. Ideally, from the FED’s perspective labor market conditions need to loosen up to allow for lower inflation.
Stock market investors had priced in a rate pause before Wednesday 14th, and they’ve got one, but by no means a dovish pause. Stock market participation has been broadening and some uncertainties are resolved: the debt ceiling and the regional bank crisis seem to be in the rear-view mirror, and inflation seems to be cooling while the credit market does not show alarming levels of stress. Although higher than the level seen at the beginning of 2022, the current level of credit stress remains comfortably below the peak experienced last October. But the ax of a lingering economic recession being forecasted by the inversion of the yield curve remains and signs of exhaustion over the leading sectors arose. Among other variables, keeping a close look at the level of credit stress will allow us to determine whether the selloff experienced during the past week is the beginning of a continuation lower or simply a pullback within the 2023 uptrend.
Check the Main Trend of stock indices, volatility, yield, currencies, and much more here.
Consider not being fully invested, taking on smaller position sizes, and holding a higher allocation of cash.
(*) The Greenwich Creek Capital “Index Trend Table” is not meant to be used in isolation, it is part of a more complex set of variables and it is not designed to provide trade entry and exit points.
Do you have a risk management strategy and a proven repetitive investment process to profit in bull markets and protect capital in bear markets? Check our website for more information about how we manage investment portfolios:
www.GreenwichCreekCapital.com
For High Net Worth Portfolios
And
www.FreedomInvest.com
The Active Asset Management Platform for Small Accounts.


