
The short answer is no, not yet. The more complex answer is that although there are more bullish short-term signals and strong momentum than what we’ve seen when the S&P 500 reached the lowest level of the year in mid-June, our quantitative process shows that the weight of the evidence remains bearish for stocks.
It looks like bond investors are front-running an economic recession and/or a scenario in which inflation picks up momentum and strength again. The 10-year U.S. Treasury yield moved sharply down from its 3.48% peak on June 14 to 2.52% on August 2. It is currently at 2.80%. The consolidation process we are seeing in the 10-year yield is typical of an uptrend that it is trying to resume. What makes us believe that scenario is possible? Some of the renewed strength we are seeing in commodities, the main contributors to inflation.
There are only two scenarios in which the 10-year U.S. Treasury yield moves up: (i) at the beginning of the economic cycle when GDP expands with no inflation, an indication of economic strength. In this case, higher yields and the stock market have a positive correlation, moving up together. (ii) The second scenario is at the end of the economic cycle when GDP contracts with accelerating inflation. In this case, higher yields indicate bond investors anticipate an inflationary economic environment, which is negative for stocks. Thus, the 10-year yield and the stock market move in opposite directions. This is where the economic cycle is now.
Additionally, credit spreads have narrowed since July, but they remain elevated and in uptrends, which is bad news for stocks. And the U.S. Treasury yield curve remains inverted: the 2-year yield is higher and on a stronger uptrend than the 10-year yield (Chart 1). The inversion of the yield curve is in anticipation of an economic recession and a wider spread should be associated with a deeper recession.
In short, the stock market’s sharp rally on Wednesday 10th and the current strength is due to stock investors’ expectations of lower inflation. Bond prices should’ve moved higher with stock prices, but no, they didn’t. Bond prices moved lower. There is a discrepancy between equity and bond investors and we don’t know who is right and who is wrong. It is worth noting that the final outcome will be very different depending on who is right.
Chart 1
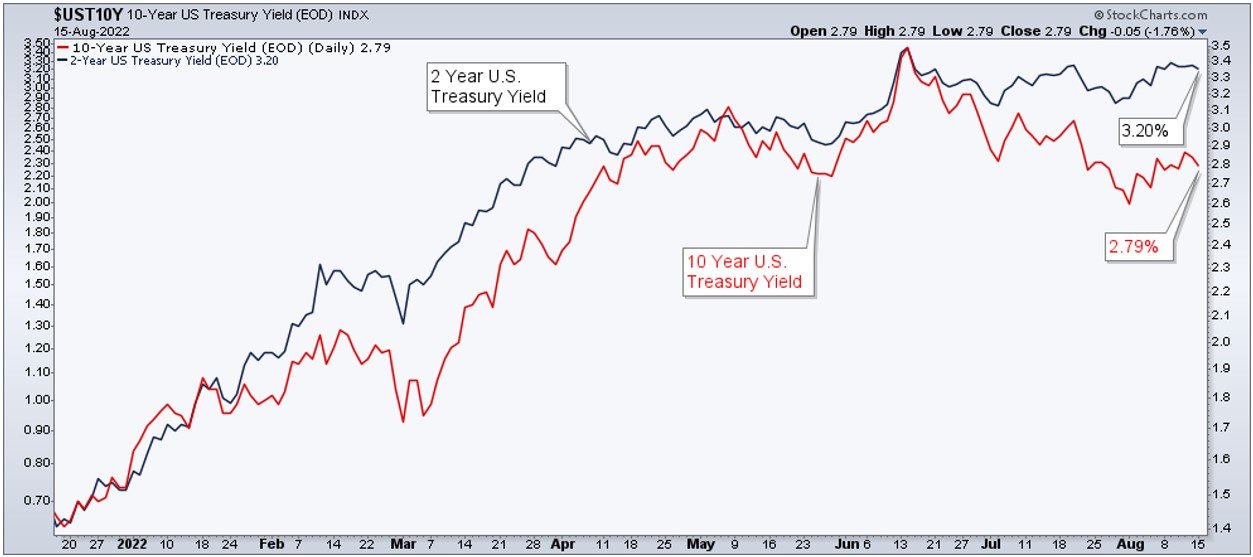
Chart 2
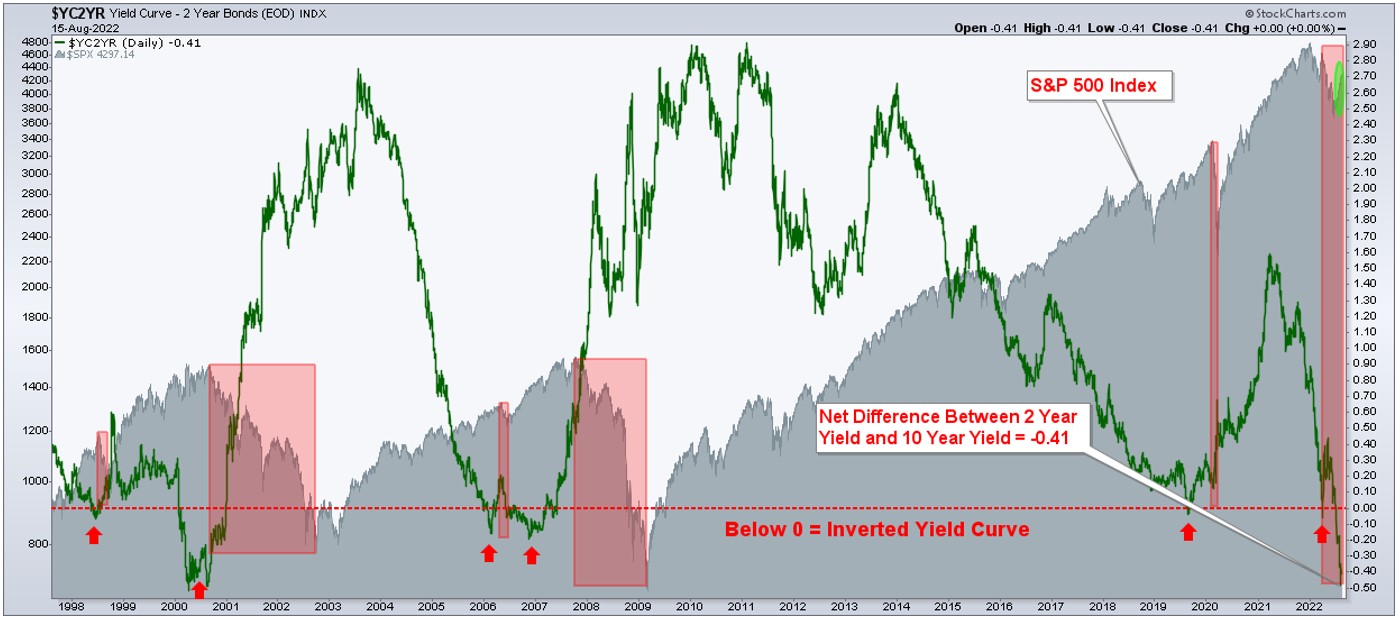
Chart 2 shows the net yield spread (green line) between the 2-year Treasury and the 10-year Treasury from 1998 to today, at -0.41 at the time of this writing. Every time the green line moves below the horizontal dotted red line, the yield curve becomes inverted. The gray shaded area is the S&P 500 index. Note that the stock market doesn’t collapse during the inversion period. Rather, it falls sharply after the curve recovers its normal shape (steep) or begins to recover it. The stock market is now recovering (top right green oval) and the yield curve remains seriously inverted. I’m not suggesting that history will repeat itself, but wonder if equity investors really believe that inflation is under control and will reach the Federal Reserve’s (FED) target soon and without putting up a fight.
Additionally, the FED remains hawkish and is not quantitatively tightening yet, although they say they will. Perhaps after the mid-term elections?
Our quantitative model remains bearish for equities but the short-term trend is up and has yet to reverse even though it is trading in a reversal resistance zone. The stock market became overbought in late July and remains overbought. Short-term support is now at the 4100 zone (chart 3, green area signaled by a red arrow). A close below this level would close last Wednesday’s gap and indicate a short-term trend reversal. The S&P 500 is now challenging resistance at the 4350 zone (green area signaled by a blue arrow) determined by the 200-day moving average and the downtrend line from early January 2022 (blue dotted line). This is the moment of truth, whether or not the index can break out of resistance, stay above it, with increasing volume and lower volatility remains to be seen.
Chart 3
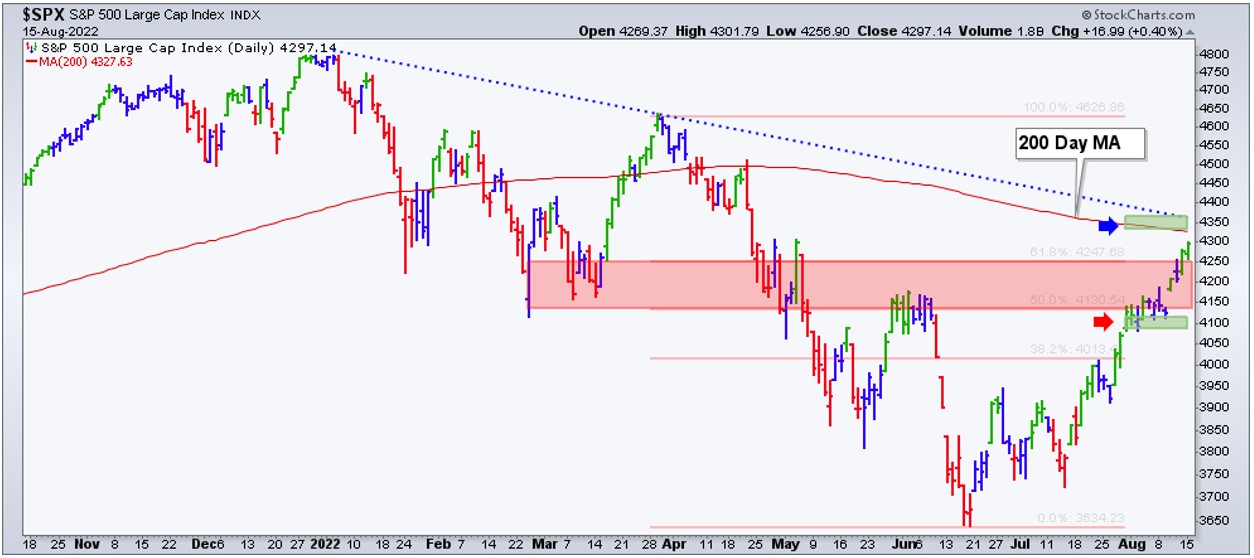
Chart 4
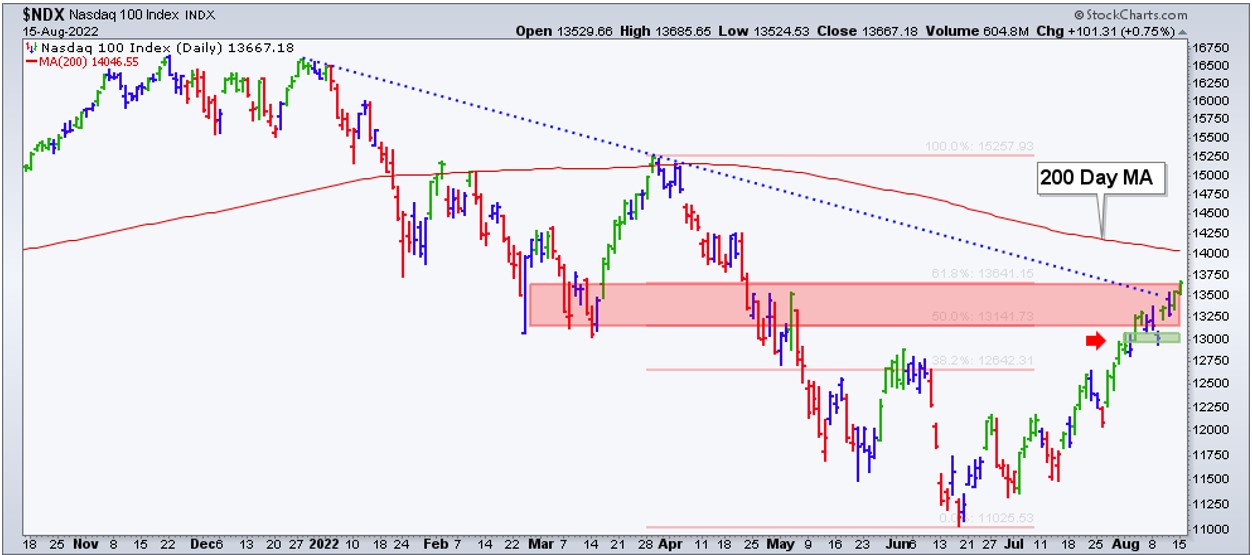
Chart 4 shows the Nasdaq 100 in a similar situation to the S&P 500. It is breaking out from its natural 50% to 60% retracement area (red shaded rectangle) and it is ready to challenge new resistance at 14000, determined by the falling 200-day moving average.
Last but not least, last week we looked at roughly 280 ETFs to conclude that about 15% are in uptrends and about 85% remain in downtrends. Interestingly, uptrends are concentrated in defensive sectors of the economy, clean energy, and biotech. Keep in mind that biotech is part of health care, a defensive sector. After the interest shown by investors in growth stocks during the last few weeks, I would’ve expected some of the tech-based ETFs to be in uptrends alongside some others in the leading sectors of the economy. They remain laggards, however.
On a more positive note, our quantitative model is showing a slight change of direction in volatility (VIX). The Main Trend of it is now bearish, which is positive for stocks. Most of the time VIX and stocks move in opposite directions. Therefore, we have no intention to fight the tape and remain on the sidelines if the stock market continues its leg up. If the last area of resistance is broken to the upside and the S&P 500 not only moves above it but remains above, we will add new positions to our portfolios. We will not hesitate to return to defensive positioning if (i) the stock market begins to roll over and breaks down from former resistance, newly support area. (ii) And the VIX goes back to a bullish Main Trend which is negative for stocks. The main risk of the stock market is still to the downside, not to the upside.
Consider not being fully invested, taking on smaller position sizes, and holding a higher allocation of cash.
Falling Dollar and Surging Stocks:
If the strength in the stock market is just another bear market rally, this move higher could last as long as momentum remains strong. In our view, a breakout in the 10-yr Treasury Yield and a breakdown in the S&P 500, would likely suggest that the bullish trend of the US Dollar will resume along with the bear market.
(*) The Greenwich Creek Capital “Index Trend Table” is not meant to be used in isolation, it is part of a more complex set of variables and it is not designed to provide trade entry and exit points.
Do you have a risk management strategy and a proven repetitive investment process to profit in bull markets and protect capital in bear markets? Check our website for more information about how we manage investment portfolios:
www.GreenwichCreekCapital.com
For High Net Worth Portfolios
And
www.FreedomInvest.com
The Active Asset Management Platform for Small Accounts.


