
As properly determined by sector leadership, the current S&P 500 Index uptrend looks like the completion of the cyclical bear market that started in Jan/Feb 2022 and the resumption of the secular bull market that started in March 2009. Although sector leadership hasn’t been perfect since early Jan 2023, when measured from then to May 26, technology, communication and consumer discretionary led stocks up, while consumer staples, utilities, and health care lagged. The former three sectors are part of the survival kit of a bull market.
Historically, the beginning and the end of bear and bull markets are not necessarily perfect, and this one is no exception. There are 21 subindustries in consumer discretionary, which is about 2/3 of GDP. Back in early January, more than half of the subindustries participated in the outperformance of the sector. At the closing of 05/26/23, only four are outperforming: Automobiles, Broadline Retailers, Tires, and Recreational Services. There are 8 subindustries in the technology sector. In early January, 6 of them were outperforming. At the closing of Friday, only two of them still outperforming: Software and Semiconductors. The latter just waking up from an April/May nap. There are six subindustries in communication: the internet has been the only contributor to the sector’s outperformance.
This is certainly a narrow-based uptrend, which is not ideal but it is an uptrend nonetheless and bull markets, whether a resumption of a secular one or a new one, have to start somewhere. Therefore, ignoring the uptrend and its sector leadership or excess complacency could become a costly mistake. Our quantitative process has given for the first time a Main Trend @GCCM buy signal for the S&P 500 ETF (SPY) since the bear market began in January 2022. As portfolio risk managers, our main responsibility now while gradually adding risk to portfolios is to figure out if stock participation narrows further or increases and if the uptrend weakens or strengthens. The importance of understanding stock market behavior in detail is to be able to determine whether the next pullback is a buying opportunity or another breakdown of the uptrend and the resumption of the 2022 bear market. This is when our risk management process steps in.
No doubt that broad market participation in stocks would be preferable, but due to the buy signal triggered on Friday 26, we decided to put market participation in the back seat as long as the uptrends in technology, communication, and consumer discretionary are not pierced. If a negative divergence between the sectors and the S&P 500 occurs, then we should resume our defensive strategy.
One of the technical requirements for the S&P 500 to remain in an uptrend is a break and closing of the index above 4179, which happened on Friday, May 19. The index closed for the week at 4191.98. Therefore, the next major area of resistance to challenge is the August 2022 height of 4305. Yes, it is also possible that the breakout fails, and if it does, we would have to switch gears to protect capital, but it is also possible it doesn’t fail. More importantly, if the S&P 500 continues on its journey to challenge 4305, the new buy signal given by our quantitative model may gain the strength needed for the next market pullback to be a buying opportunity instead of a breakdown of the uptrend. Therefore, the importance of breaking above 4179 and challenge 4305. The S&P 500 closed on Friday 26 at 4205.45, roughly 100 points below 4305 (~2.4%).
In terms of the economy, the 2nd reading of GDP for the first quarter (Q1) came in at 1.3% vs 1.1% which shows a little improvement from the previous reading but is still consistently low. This is in line with what the Federal Reserve (FED) wanted to achieve by hiking rates, a slowdown of economic growth to cool down inflation, which in turn may bring the economy into a recession. Also, the money supply is contracting which is an important element alongside weakening commodity prices in the fight against inflation.
Nevertheless, April Personal Consumption Expenditures (PCE: what people pay for goods and services) and Personal Spending (PS) came in stronger than estimated:
April 0.4% actual vs. 0.3% estimated month/month.
Core PCE: 4.7% actual vs. 4.6% estimated year/year.
PS: 0.8% actual vs. 0.4% estimated.
Most likely the above numbers will keep the Federal Reserve under pressure in its fight against inflation. All this agrees with a sharply inverted yield curve we’ve been seeing since July 2022 and may suggest the FED may have trouble pivoting or pausing interest rate hikes any time soon. On top of strong PCE and PS readings the economy may face additional headwinds from two different fronts: (i) the story on regional banks may not be over yet (further bank consolidation and credit contraction are expected) and (ii) there are many companies, most of them within the start-up universe, that enjoyed free capital while interest rates where at 0%. The flow of capital to many of those companies has dried out and many have no real cash flow to remain in business. Thus, we may have not seen the worst in terms of the impact on the real economy yet, but the stock market seems to be looking beyond a recession while the bond market seems very concerned about a deep recession and not as excited as the stock market is.
What to do next? We strongly believe that investors without an effective risk management strategy and diminishing the likelihood of a deep economic recession may end up taking on unnecessary volatility in their portfolios should the recession proves to be worse than what the stock market expects. Keep in mind that bear markets may not create recessions, but historically, every recession creates a bear market. Therefore, the importance of knowing where to look for clues regarding the sustainability of the current uptrend in stocks. A hint: the interest rate is one of the variables.
Conclusion and action plan:
Bull markets have to start somewhere and early moves are seldom perfect. Therefore and in the event this becomes a solid bull market, gradually adding risk to portfolios to benefit from the predominant uptrend but using tight stops to be able to get out of the way if the stock market rolls over, is the prudent strategy to enforce.
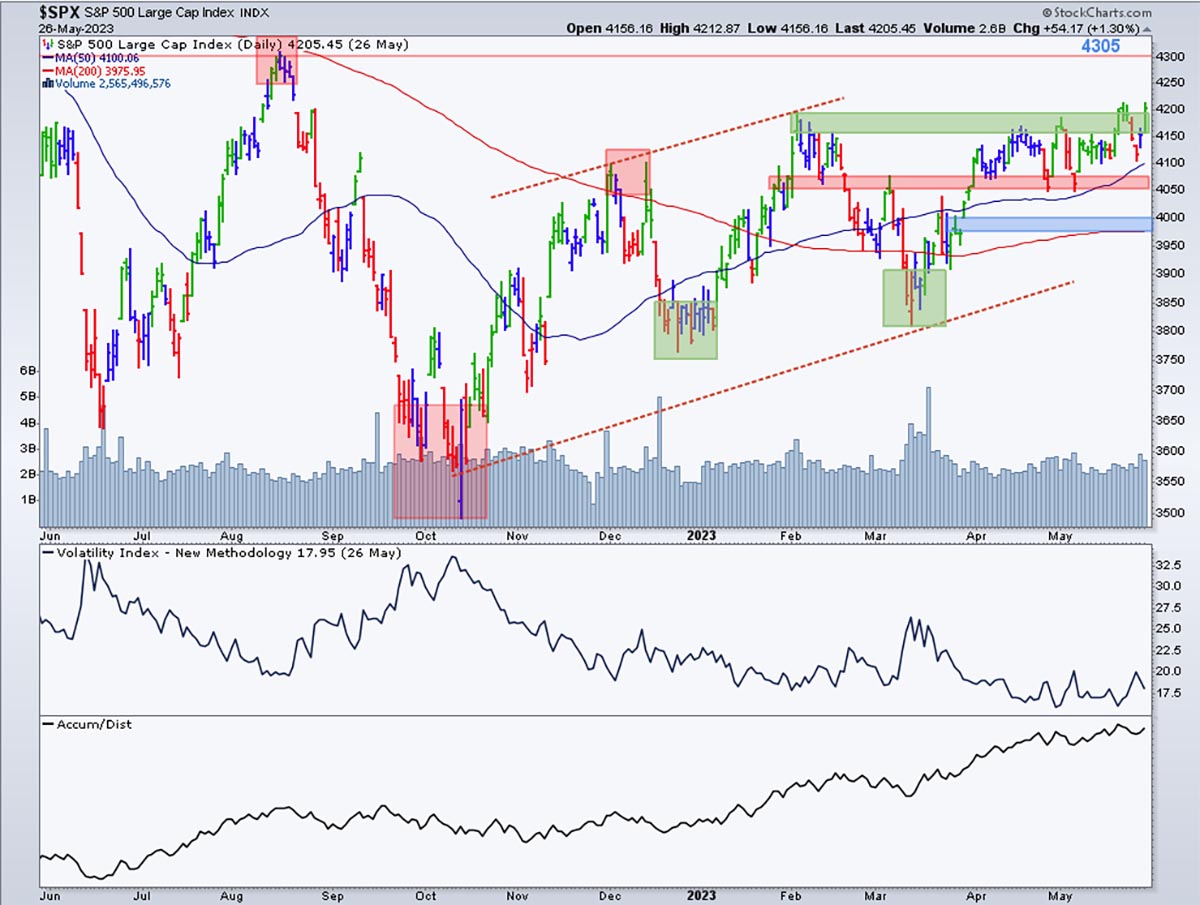
Chart 1 shows the S&P 500 Index building higher highs and higher lows (green-shaded squared areas) since December 2022. As mentioned before, if the index continues on its uptrend to challenge 4305 the fight for the bears to prevail is likely over, at least short term. But if the index is not able to challenge 4305 (upper right corner), it is important that it remains between 4200 and 4050/4075 (pink shaded horizontal line) to consolidate further. If 4050/4075 does not hold, 3975/4000 must hold, otherwise the risk is that the index may test the October lows. Is such a negative scenario possible? Of course, it is. But is it probable? Not today in our opinion. It will all depend on the strength of the forthcoming recession and whether or not the stock market is underestimating its depth and longevity, and this is the discrepancy between the stock market and the bond market. Therefore, the need for a proven and effective risk management strategy to protect your capital. The quadrants below the chart show volatility under pressure and below 20 (center), which is a positive for stocks and Accumulation/Distribution (bottom quadrant). Note the big improvement in the accumulation trend since the beginning of January 2023, which is another positive for stocks.
Chart 1
Check the Main Trend of stock indices, volatility, yield, currencies, and much more here.
Consider not being fully invested, taking on smaller position sizes, and holding a higher allocation of cash.
(*) The Greenwich Creek Capital “Index Trend Table” is not meant to be used in isolation, it is part of a more complex set of variables and it is not designed to provide trade entry and exit points.
Do you have a risk management strategy and a proven repetitive investment process to profit in bull markets and protect capital in bear markets? Check our website for more information about how we manage investment portfolios:
www.GreenwichCreekCapital.com
For High Net Worth Portfolios
And
www.FreedomInvest.com
The Active Asset Management Platform for Small Accounts.


