Since the stock market turmoil began last year we’ve been writing about the correlation between the Treasury yield and S&P500, which started to diverge in early January 2019 (blue rectangle, Chart 1). Most of the time the correlation is positive but from time to time, it diverges. We also mentioned the warning signal of a slowing economy suggested by the behavior of the Treasury yield, which was confirmed all along by economic data but equity investors seemed to have ignored the signal. Instead, investors focused their optimism on trade negotiations until they realized that the outcome, whether good or bad, will take longer than expected.
Correlation between S&P500 & 10-Year Treasury Yield
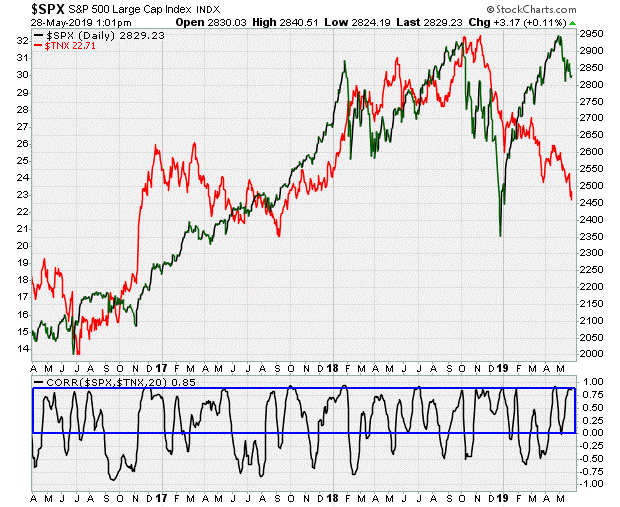
Chart 1
It seems that the bulls have been running exclusively on the beacon of trade with China. Therefore, the right question to ask now is if there is something else to sustain the market and inspire new commitment of capital, while economic data keeps weakening.
From a risk management perspective, one of the problems we have is that even without losing the 2009 uptrend (yellow line, chart 2), a test of that line equals to about -15% drop from current S&P500 levels. In the Nasdaq the same test of the 2009 uptrend equals a selloff of about -25% to -27%.
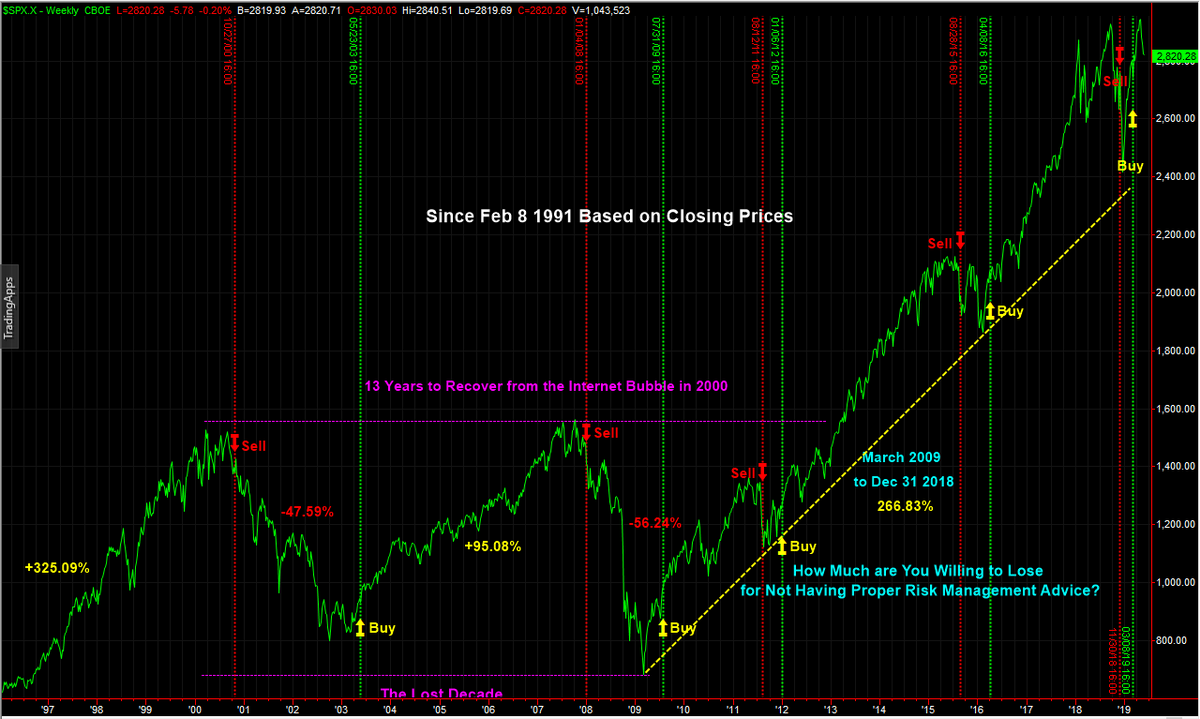
Chart 2
On Tuesday, both the S&P500 and the Nasdaq sold-off on higher volume than the previous positive day on Friday, while treasury bonds kept rising in price and yields dropped. Last week, we mentioned the importance of the 2800 support level. Today, the S&P500 gapped below it, finding support on the widely followed 200 day moving average.
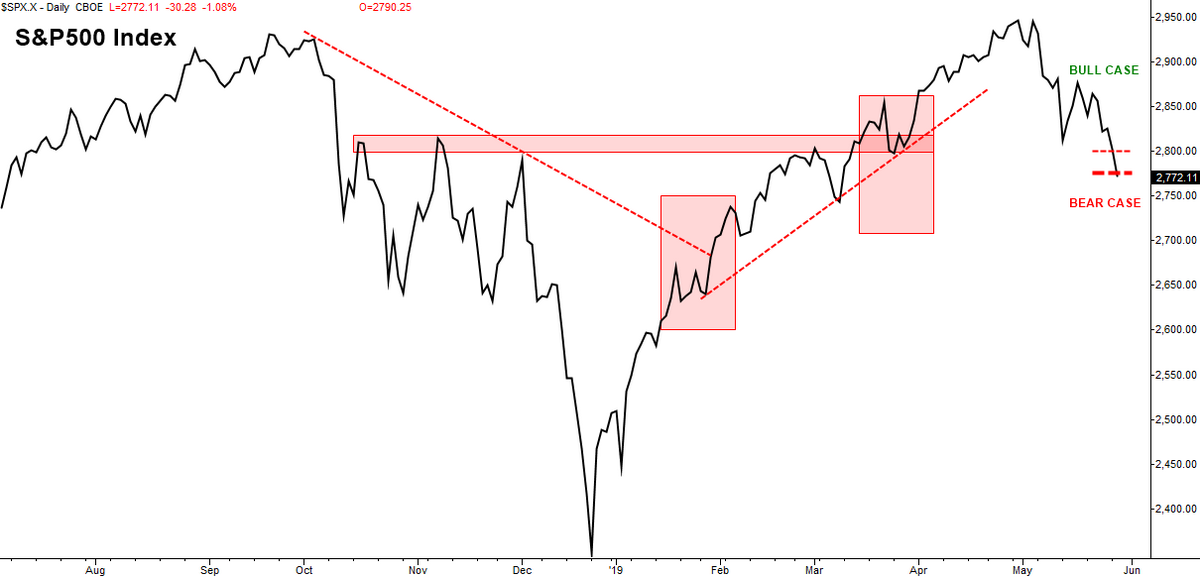
Holding the ~ 2776 area is important. A close below this level would suggest more selling to come. Although the Russell 2000 and the Dow Industrials Indexes don’t look like promising charts, the Nasdaq and the S&P500 are holding for now. If the S&P500 holds support, it may be enough to bring the lagging indexes up with it, as the S&P 500 accounts for 80% of the US equity market. So far, bond investors have been much more rational in understanding the trend of the economy than equity investors, who seem to be waiting for a “tweet” to turn the market up.
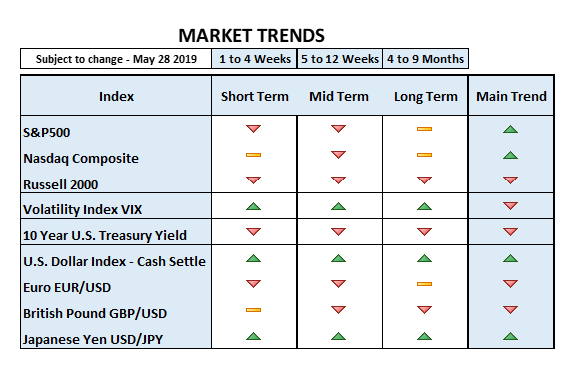
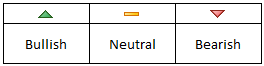
In summary: The S&P500, Nasdaq and Russell 2000 are turning bearish in sync with dropping Treasury yields. Volatility is picking up and equity selloffs have taken place on higher volume, with a strengthening USD and Yen. Additionally, the yield curve is inverted, which is typically associated with economic recessionary periods. The inversion is because all T-Bills are currently yielding more than Treasury Notes, including the 10 Year Treasury. These are not positive signals for equities. Usually investors look at the yield curve between the 2 Year and the 10 Year. Currently, the 10 Year is still above the 2 Year, so it remains normal (at least for now).
In terms of asset allocation, we’ve been reducing beta (risk) during the last few months. Our goal was to develop and implement a defensive strategy for market pullbacks/corrections (sell-offs). We are closely monitoring today’s price action, which seems to suggest a possible short term reversal.
As of yesterday’s market close: