Facts first: PCE inflation rose 0.118% headline and 0.135% core in April, pulling the year-on-year PCE inflation rate lower for a second consecutive month. The headline rate was 2.69% in February, 2.29% in March, and 2.14% in April. The core inflation rate was 2.96% in February, 2.65% in March, and 2.52% in April.
Headline inflation and core inflation are two key measures used to track price changes in an economy.
• Headline inflation refers to the total inflation rate, including all items in the Consumer Price Index (CPI), such as food and energy. Because these categories can be highly volatile, headline inflation often fluctuates due to short-term price swings.
• Core inflation excludes food and energy prices to provide a more stable measure of long-term inflation trends. Policymakers and economists often focus on core inflation because it helps them assess underlying inflationary pressures without the noise of temporary price shocks.
Both measures are essential: headline inflation reflects the immediate cost-of-living changes, while core inflation helps gauge persistent inflation trends.
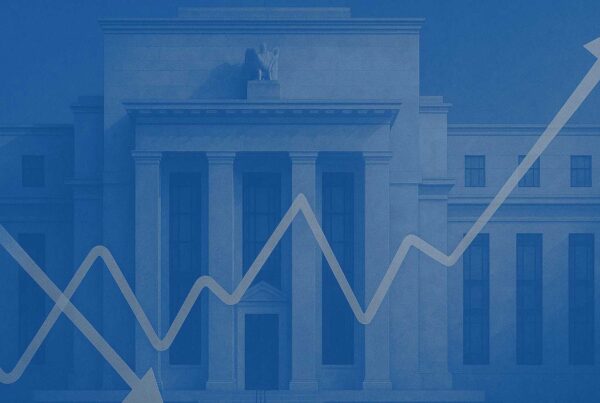
The chart below shows both headline and core inflation tracking lower.


The prevailing thought at the Fed, investors, and the financial media is that inflation resulting from tariffs will eventually materialize. However, treasury yields do not seem to agree, as they have weakened over the last few days and remain unchanged, at least for now. Yesterday, yields rose sharply due to stronger-than-expected non-farm payrolls and the unemployment rate remaining at 4.2%. Nevertheless, in our opinion, the main trend of yields remains bullish, supporting a mild reacceleration of CPI (inflation) in the U.S. due to economic strength, rather than tariffs. More on this later; however, remember that what moves financial markets is the expectation of growth, inflation, and monetary policy (the Fed bias) in the economic cycle.
The US Dollar and volatility ($VIX) are in a bearish trend, and the S&P 500 and Nasdaq are now in bullish trends. Regardless of a stellar performance in Q1 2025, Gold is now underperforming the S&P 500 Index, and the Nasdaq 100 is outperforming the latter. This fact puts a bid on growth stocks and Bitcoin (IBIT).
The Atlanta Fed’s GDPNow model has raised its Q2 2025 U.S. GDP growth estimate to 4.6% as of June 2, 2025. This is a sharp increase from the previous 3.8% estimate on May 30. The revision was driven by stronger-than-expected consumer spending, business investment, and a narrower trade deficit. This latest projection suggests momentum in the economy has accelerated, despite concerns about tariffs and geopolitical headwinds.
Growing momentum in the economy is one of the factors that leads us to believe inflation will slightly accelerate in June and July. This, combined with accelerating GDP growth in the U.S. economy and perhaps the global economy, helped by interest rate cuts in Europe and China, marks the beginning of Phase II in the economic cycle. Phase II occurs when both economic growth and inflation accelerate together.
During Phase II, growth outperforms value, and Nasdaq outperforms S&P 500. This is why, since early May, gold has underperformed the S&P 500, while growth is gaining traction. If this trend continues, as we believe it will, the U.S. stock market is likely to remain in a bullish uptrend, supported by easing monetary policies in Europe and Asia, which are expected to foster global growth. This trend is also likely to be bolstered by a more favorable regulatory environment in the U.S., combined with lower taxes and energy prices.
Conclusion: The U.S. and global economies may fluctuate between Phase II and Phase III during the second half of the year, with a low probability of rate cuts in the U.S. and a non-recessionary global environment. We expect volatility to increase if either the U.S. or global economy, or both, go back to Phase III in the economic cycle. Phase III occurs when inflation accelerates and GDP growth decelerates.