May 17th, 2019
In our last post (here), we explained the behavior of copper and bonds relative to the fundamentals of the economy. The conclusion was that both copper and bonds have been signaling economic weakness during the last year. Financial markets are still dealing with a few headwinds: an unclear Brexit strategy, lower GDP estimates from the European Union for 2019 and 2020 (1.2% and 1.5%, respectively), 25% trade tariffs on $200 billion of Chinese exports to the US, and Chinese retaliation with tariffs on $60B worth of U.S. goods.
Chinese exports fell 2.7% year-over-year in April, even prior to the new U.S. tariffs. The tariff implications might include:
- Lower prices for Chinese exporters to offset the additional cost imposed to their products, making them more expensive and less competitive
- Higher prices for US importers and consumers due to import tariffs
- Lower margins for all businesses involved
- Perhaps even inflation in the US due to higher retail prices
- The consequence of point 4 would be a stronger US Dollar.
- Additionally, trade tensions and Chinese retaliation may only worsen the current weak economic scenario in China.
As we have mentioned in previous posts, after the miscalculated rate increase in December, the Federal Reserve became vocally “dovish” to fix the error. The likelihood of higher retail prices due to tariffs may trigger higher inflation, which may lead the Federal Reserve to revert back to hawkish policy (higher rates). Higher rates may strengthen the US Dollar with the usual negative implication for Emerging Markets and other currencies as well.
Economic data still shows a slowing economic environment in the US and abroad. Increasing rates in a decelerating economy is the same scenario we had during the last quarter 2018. And now we know how the market reacted to it (~20% drop). We are not suggesting that this will be the final outcome. In the investment world, everything is about probabilities and anything is possible. But is such scenario likely?
At the time of this writing, we do not know the answer to the question. But we will continue analyzing financial markets to figure out the correct answer in due course.
For the time being, we can only analyze the data we know and the probability of said data moving in one direction or the other. Then, we manage risk accordingly and adjust positioning as the data changes and probabilities shift. No guessing.
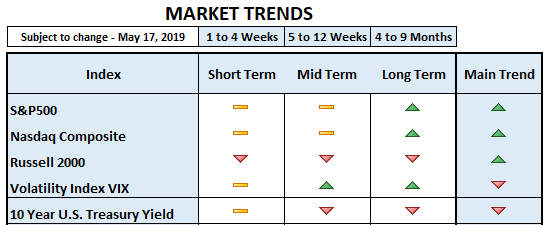
As of today:
Inflation: The bearishness of the 10 year US Treasury yield and the behavior of commodities, including the energy sector (not necessarily oil), indicates no fear of inflation yet.
Main Trend: Regardless of the selling pressure experienced during the week, it is still bullish for the S&P 500 Index and the Nasdaq Composite. The main trend is bearish for commodities.
Pockets of Strength: We see leadership from consumer discretionary, technology, communications and industrials. This kind of leadership is positive for the stock market. But the strongest leadership is in defensive sectors (utilities, real estate, consumer staples).
Pockets of Weakness: Energy (not including oil), materials, healthcare and small caps. Ideally, for a sustainable bull market small caps should join the leaders above.
Yield Spread: It is the spread between corporate bonds and government bonds. It serves as a measure of risk. The yield narrows in good economic times when investors are willing to take more risk. It widens in bad economic times, as investors become risk averse. The correlation between the S&P 500 Index and yield spread is negative, most of the time. When the S&P 500 moves up, the yield spread moves down and vice versa. The spread widened (moved up) in October / December when the S&P 500 moved sharply down. It started to narrow again, as the index recovered from January to April. Currently, the spread is slightly higher than its April reading, but still low and below the March level.
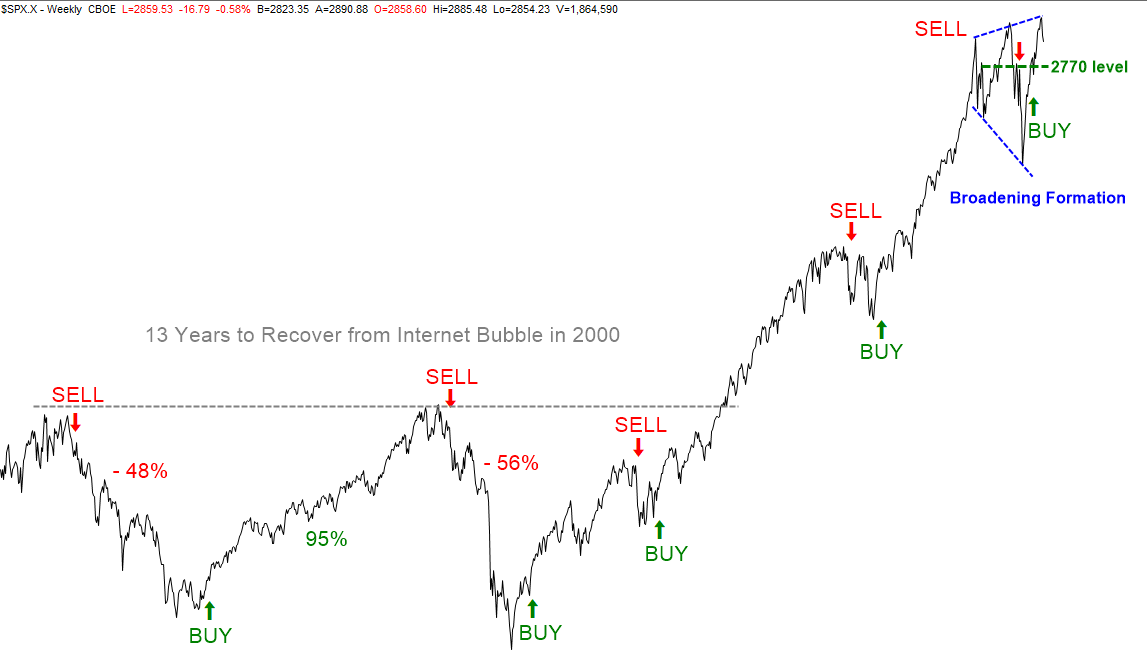
Broadening Formation: The S&P 500 Index has been building higher highs and lower lows since early 2018. Although this formation is usually associated with irrational markets, it doesn’t necessarily end up in a bear market. Sometimes, the opposite is true. See chart below.
Currencies: The main trend of the US Dollar is still bullish.
Gold: It should benefit from lower Treasury yields, but the strong US Dollar is a headwind.
Volatility: Throughout last week (May 6th-10th), we had higher volatility levels, which indicated a high level of fear. Implied volatility traded at a premium of almost +90% versus realized volatility, which created the oversold bounce we had this week. Additionally, the volatility index found resistance at its January high and has moved lower since then. In order to extend the bounce in the S&P500, the volatility index should remain below 16 (closed at 16.14 today).
Conclusion: The main trends of the S&P500 and Nasdaq Composite are still bullish. Therefore, the current move down may be a natural pullback, which is normal and healthy in bull markets. Especially, since we haven’t seen a pullback larger than ~3% all year until now (~5% drop). From a technical perspective, the S&P500 closed below the 50 day moving average (a popular level) today. The risk is that many traders will be disappointed and act on that disappointment on Monday. In that case, the Index may continue down to test the March lows and the 2770 area. See chart below.