I agree that this is not a perfect bull market, but for the time being, it is not a bear market either. What do I mean by “perfect” bull market?: A broad based uptrend where every single sector of the economy moves up. The 2019 stock market recovery has not been perfect but in our opinion it qualifies as a bull market that may continue higher nonetheless.
First and foremost, first quarter (1Q) 2019 GDP growth was 3.1%, 2Q GDP growth 2% and 3Q GDP growth 1.9%. The spread between the 2 year Treasury Yield and the 10 year maturity has been widening during the month of October. A steepening yield curve is supportive of economic expansion ahead.
The Federal Reserve (FED) just announced a 0.25% rate cut. The benchmark rate is now 1.5% to 1.75%. Although the FED signaled a “pause” for future rate cuts, the bottom line is that lowering interest rates in a non-recessionary economic environment with no inflation (at least running below the FED’s target) would only help economic activity improve. Perhaps this is what the yield curve is anticipating. Certainly, this scenario should be good for stocks.
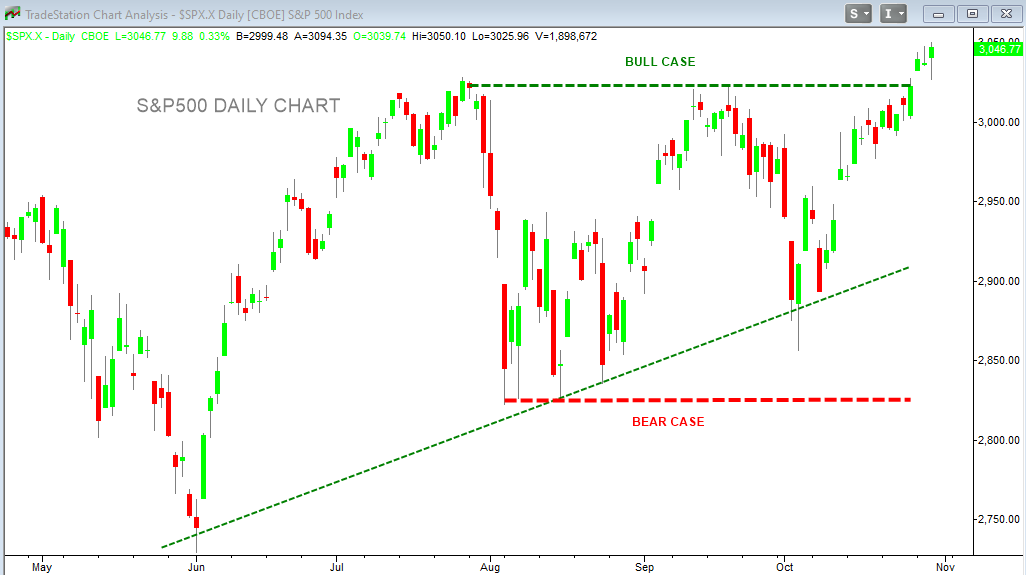
The S&P500 and Nasdaq are breaking out of bullish price patterns. The Semiconductor Index (SOX) broke out above resistance. Last week, we mentioned that transports have led an incredible rally since early October after reaching a triple bottom in June, August and October. The index moved up to challenge 10,800 and managed to close at 10,856, favoring a possible challenge of its April high at 11,000.
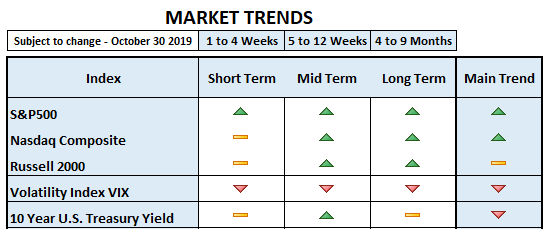
S&P400 Mid Cap Index has mainly been moving sideways, but building slightly higher lows throughout the summer, trying to resume its uptrend. The Russell 2000 Small Cap Index, although it built a higher low in October, is still in a downtrend.
The technology sector (XLK) is also forming a bullish price pattern and managed to break out to the upside on Friday. The same applies to the financial sector (XLF), breaking out above its late July/Sept highs.
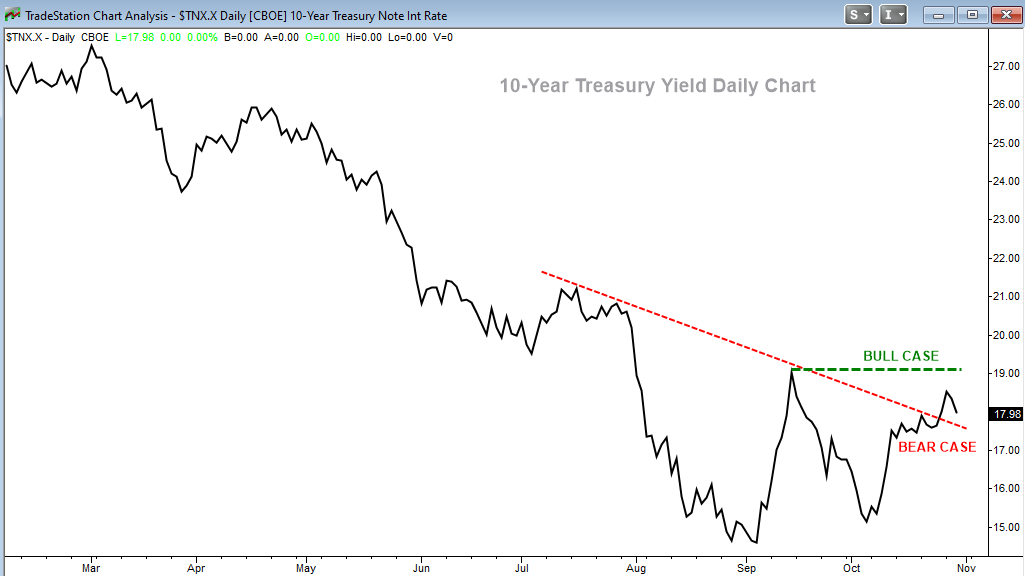
The 10 year US Treasury Yield built a higher low in early October and the consolidation (sideways) move taking place since mid-October may be an indication that a move up to challenge 1.90% is possible. Such a move would be positive for the financial sector due to the steepening of the yield curve and may indicate a continuation of capital rotation out of treasuries and into stocks.
After a consolidation (sideways) move that started in August, gold may be ready to continue its move up. Such a move would be in line with lower interest rates. But I just mentioned that the yield curve is steepening, which would actually be negative for gold. Since this is not a broad based bull market, however, some correlations may change. Although it’s not the norm, it would not be the first time that the S&P500 and gold move up together temporarily like they did in early 2019 and later in June/July. For the time being, we are holding our exposure to gold.
Additionally, commodities (CRB Index) remain at extremely low levels, the lowest since the mid-80s. Low commodity prices are good for equities, while rising commodity prices are a bad sign for stocks due to their inflationary implications. We’ve written in the past that wage inflation is negative for stocks when earnings and sales are moving lower, like now. This is because higher wages coupled with lower earnings negatively affect the bottom line of companies. In this particular instance, we believe the FED’s monetary policy will end up helping stocks, regardless of wage inflation. Low inflation overall may be helping gold and equities at this juncture.
Bottom line: The good news is that the S&P500 is in an uptrend, breaking out and reaching an all-time high. The bad news is that money is mainly focused on value, instead of growth. Therefore, and just in case, this is a bull market that should be played with a tight risk management strategy in place.


