
Four important facts about the stock market action of late:
- 2-year Treasury (TSY) Yield is rising.
- The inversion of the yield curve.
- The US Dollar (USD) broke out of the downtrend and is rising.
- CBOE Volatility Index ($VIX) is building lower highs and lower lows.
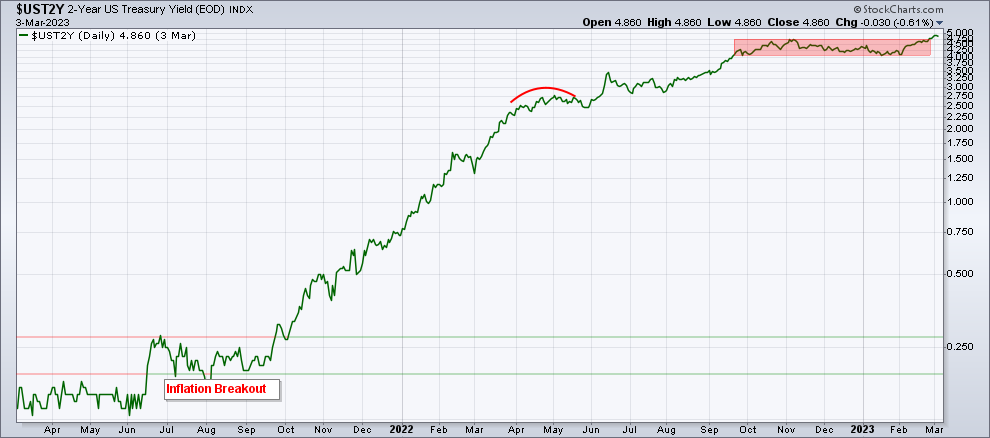
During the late Phase 4 economic cycle, when GDP growth contracts and inflation decelerates, the most important threat to stocks is interest rates moving higher to fight inflation, even if inflation is decelerating. Chart 1 shows the 2-year TSY yield breaking out of a consolidation process that started in mid-September (red box). The yield is now climbing higher in expectation the Federal Reserve will have to continue rising short-term interests above the inflation rate to bring the latter under control. At 4.86% the 2-year yield is already above the Oct/Nov highs.
Chart 1
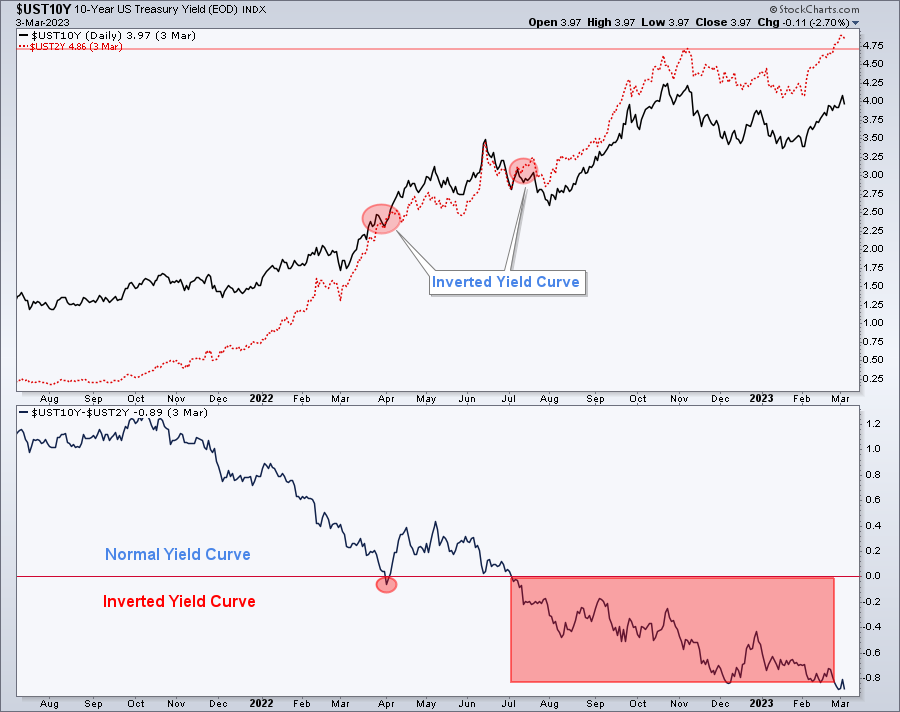
Long-term TSY yields are rising too, but at a much slower pace than short-term rates. The immediate result of short-term rates (red-dotted line on Chart 2) moving higher at a faster pace than long-term rates (solid line) is a sharper inversion of the yield curve, which is now the most inverted we’ve ever seen. Friday’s closing put the inversion at -89 bp (solid line breaking down from the red-shaded area). The 10-year Treasury Yield is rising again and comfortably remains above its 200-Day MA (not shown), which is also bullish for yield and should be bad news for stocks. The 10-year yield looks willing and likely to challenge 4.49%, its high mark on Oct. 29th. At the time of this writing, the yield sits at 3.96%.
Chart 2
The USD broke out of its downtrend and is now rising. The consequence of higher yields is a stronger USD which is negative for stocks. Simply put, a stronger USD makes US exports more expensive to foreign buyers and US companies less competitive than their foreign counterparts. Additionally, as interest rates continue to move higher, institutional money such as pension funds and insurance companies at a certain point may opt to lower their exposure to equities in favor of fixed high-yielding bonds.
The immediate conclusion on points 1, 2, and 3 above would be that neither one is favorable to stocks recovering the Bullish Main Trend @GCCM Index Trend any time soon. Furthermore, the headwind can be intense and currently, we do expect volatility in the stock market to continue at least into the spring.
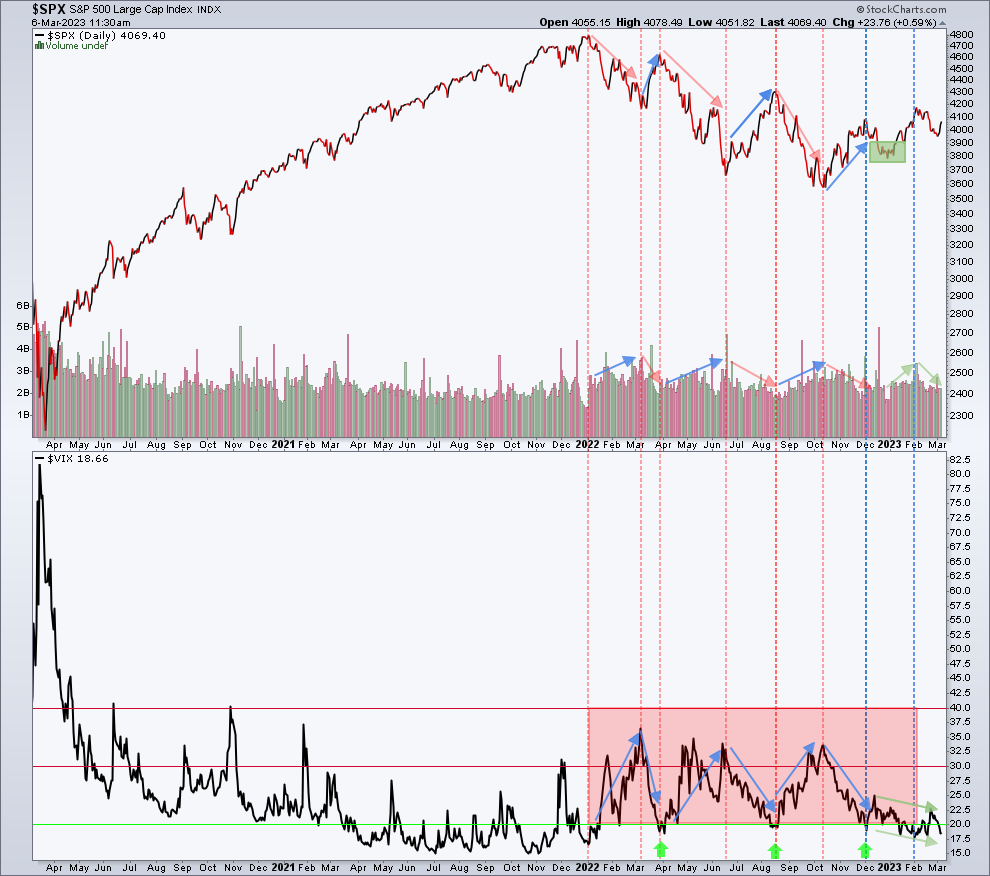
In reference to point 4 above: CBOE Volatility Index ($VIX) is building lower highs and lower lows. The move favored the stock market’s short-term uptrend that began in mid-November. Chart 3 shows a daily chart of the S&P 500 Index in the upper quadrant and $VIX in the lower quadrant. Notice that since the bear market began in early 2022, every time the stock market dropped, it did on higher volume and higher $VIX. That is the definition of a bear market. Notice that in December the S&P 500 Index managed to build a higher low (green shaded box) and from there, it moved higher on increasing volume and lower volatility (green arrows on the lower quadrant). That is the definition of a bull market: higher prices, increasing volume, and lower $VIX.
Chart 3
Will this trend continue and finally trigger a bull market Main Trend @GCCM Index Trend Table? There is no sure way to know. Our quantitative process still signals the S&P 500 and Nasdaq are in bear market Main Trends, but the model turned short-term bullish in early January. If this trend continues the Main Trend signal will eventually change.
Based on the December higher low of the S&P 500 (green box), increasing volume thereof, lower $VIX, and the fact that our quantitative model turned short-term bullish in early January, we added some risk to portfolios on January 12. The risk includes the S&P 500, Nasdaq, Technology, within Technology Semiconductors, Energy which seems to be building a consolidation base, Metals & Mining, Japan, and a lot of U.S Treasury Bills.
Since we bought the above positions, they have experienced first a breakout and then a sideways or lateral consolidation moving lower on lower volume. Usually, this is an indication that not many are willing to sell. On the contrary, we’ve noticed some accumulation trends which is a positive sign, while the consolidation patterns continue.
Although these are all bullish signs properly supported by capital rotating into growth, the big question is if this move up is sustainable considering the Federal Reserve’s hawkishness due to the threat of inflation and the strength in certain areas of the U.S. economy.
Conclusion: It is really easy even for novice investors to deal with a bull market. It is much more complicated to deal with a bear market and the level of complexity increases when financial markets are in the gray area, like now.
When things get complicated, simplicity should prevail. In this case, a simple trading plan seems like the best option.
- Trading Plan: While we are taking a wait-and-see approach to figure out if the consolidation move breaks out to resume the short-term uptrend or it breaks to the downside, the trading plan is simple. Allocate more capital to risk if a bullish breakout takes place or reduce exposure to risk if the immediate support areas do not hold.
- Since the bear market started, this is the first S&P 500 rally showing some resilience, but headwinds are rising again.
From a macro perspective as of the closing on Friday 3:
- Good for stocks:
- Capital has been rotating from value to growth
- The S&P 500 and Nasdaq 100 are in short-term uptrends
- Volatility, although still elevated, remains under pressure
- Commodity prices are moving lower (should help on the inflation front)
- Oil ($WTIC) prices are moving lower (same as above)
- Not good for stocks:
- Treasury yields regained strength and continue to move higher while pushing bond prices down, perhaps discounting future higher and/or stubborn inflation à Hawkish FED
- $USD is breaking to the upside again
- Sharply inverted yield curve
- The Main Trend @GCCM Index Trend for the S&P 500 remains bearish
We are monitoring these trends very closely to either gradually continue allocating risk to portfolios on the pullback or go back to defensive mode if our support areas do not hold.
Check the Main Trend of stock indices, volatility, yield, currencies, and much more here.
Consider not being fully invested, taking on smaller position sizes, and holding a higher allocation of cash.
(*) The Greenwich Creek Capital “Index Trend Table” is not meant to be used in isolation, it is part of a more complex set of variables and it is not designed to provide trade entry and exit points.
Do you have a risk management strategy and a proven repetitive investment process to profit in bull markets and protect capital in bear markets? Check our website for more information about how we manage investment portfolios:
www.GreenwichCreekCapital.com
For High Net Worth Portfolios
And
www.FreedomInvest.com
The Active Asset Management Platform for Small Accounts.


