April 29, 2019
The uptrend in the stock market continued to strengthen last week, while volatility remained under pressure. We analyze financial markets, stocks and volatility using different timeframes. We do this to accurately assess short, mid and long term trends, which allows us to determine the main trend of the security or market in question.
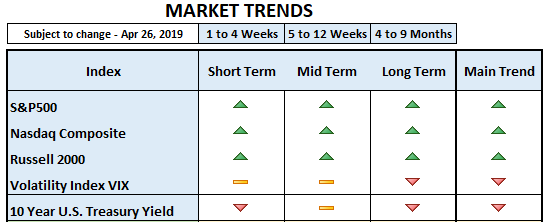
Our Market Trends table last week (click here), showed 9 neutral signs, 6 bullish and 5 bearish for the S&P 500, Nasdaq, Russell 2000, Volatility Index and 10 Year U.S. Treasury Yield. As of Friday’s closing, the updated Market Trend table for the same indexes shows 12 bullish arrows, 5 bearish and 3 neutral. Most of the neutrals we saw in our April 22nd update, changed to bullish by the closing on April 26th. The US Dollar continued to regain strength and remains bullish main trend. It is good to see short and mid-term neutral signals on volatility, while its long and main trends remain bearish. If volatility remains low, this is certainly good for the stock market.
But notice that the 10 year Treasury Yield at 2.50% remains mainly bearish. This behavior is not typically positive for equity markets, unless the downtrend in yields is mainly due to high demand of U.S. Treasuries. Negative yields or extremely low yields in 10 year government bonds abroad may be driving demand for U.S. Treasuries (i.e. those issued by Germany (-0.018%), Japan (-0.047%), France (0.355%), UK (1.145%), Spain (1.032%), Italy (2.57%) and China (3.434%)). If this explains the downtrend in the 10 Year Treasury Yield, then perhaps yields aren’t signaling further economic weakness ahead and equities may move higher.
Also, the U.S. Yield curve remains partially inverted: maturities within one year offer higher returns than government notes maturing in 2 yr., 3 yr., 4 yr., 5 yr. and 7 yr. Only 10 yr. to 30 yr. maturities yield higher returns than the short term issues maturing within a year. This is important because an inverted yield curve is usually associated with an economic recession. Although this is only a partial inversion, perhaps we are in the waiting room for an inverted yield curve, where short-term yields are higher than longer-term yields. The market usually focuses on the spread between the 2 Year and the 10 Year Treasury Yields (learn more), which remains positive at the time of this writing.
Regardless of yield, the conclusion of our last post on April 23rd is that the stock market rally seems healthy. Leadership in financials and transports continued to the end of the week and we also saw more broad participation, including small cap companies.
GDP growth for the 1Q 2019 was announced on Friday, beating all consensus expectations with a 3.2% rise. It was better than last year’s 3% for the same period. The surprisingly high number was achieved because almost every sector contributed to growth, which is not always the case. But the two main contributors to achieve sustainable growth during the rest of the year, consumption and business investment, both slowed with soft inflation during the first quarter.
Conclusion: Yes, GDP growth for 1Q 2019 was far better than expected and the stock market seems healthy. But softness in consumption and business investment seems to play along with a continuing global slowdown. If we are right on our assumption, the good news is that if the Federal Reserve really looks at inflation, not unemployment or growth to establish their monetary policy, they may end up cutting rates to assist the economy in getting back on track. If this is the case, it should be positive for the stock market.
Below is the trends table as of Friday’s closing: