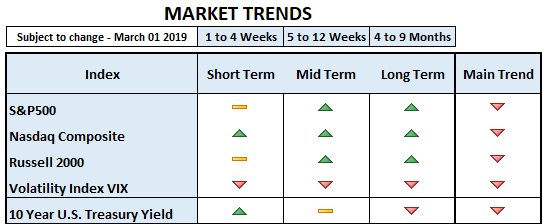
Despite a stellar performance in the S&P500 since the beginning of the New Year, US treasury yields remain stubbornly low regardless of the latest spike. In an improving economy, stocks and yields should move in the same direction, up. Three different circumstances may be preventing yields from moving higher in the US:
- Perhaps investors are expecting lower GDP growth in the months to come (lower economic growth, lower yields).
- The surprisingly dovish turn taken by the Fed during January, has strongly reduced the likelihood of multiple rate hikes during 2019.
- Negative 2-Year Treasury Yield and almost negative 10-Year Treasury Yield in Germany, may be keeping US Treasury Yields on the low side of the range. No doubt that a more dovish Fed has not only provided support, but a big lift to US equities.
The question remains whether or not Fed action (halting rate hikes and a dovish stance) will be enough to prevent the US economy from slowing down too much.
Since October, the move up in gold suggests that investors have been buying gold, regardless of equity performance during 2019 and regardless of US Dollar (USD) strength. USD and commodities, including gold, usually move in opposite directions. Therefore, the interest in buying gold despite USD performance could be associated with hedging stock market risk. Gold performs very well in low interest rate environments.
Coincidentally enough, as gold started to outperform in early October, the German 10 year yield started to move lower and soon after, the US Treasury 10 year yield started its move lower too. Perhaps lower yields are creating the demand for gold regardless of USD strength. But keep in mind that lower yields are usually associated with lower economic growth.
It is also quite interesting to see demand for Gold Miners (GDX), which were out of favor since 2011. GDX is performing even better than gold and comfortably outperforming stocks. Commodity prices including copper have been improving, too. Would this be an indication of possible future inflation?
Our fundamental research indicates that the US economy may be transitioning from an end-cycle to late-cycle. To clarify, “end-cycle” means decelerating GDP growth and inflation, usually the cause of a bear market. “Late-cycle” refers to the previous stage in which GDP decelerates, while inflation continues to pick up some strength. This may be a 2019 2nd Quarter and 3rd Quarter cycle.
Conclusion: Lower 10-Year Treasury Yield alongside increasing demand for gold, plus increasing commodity prices (if this trend continues), may be an indication of lower economic growth associated with higher inflation. As of Friday, 483/500 companies in the S&P 500 Index reported sales growth of 6.22% and earnings growth of 12.04%. So far, earnings in 4th Quarter 2018 are growing at half the pace of the 3rd Quarter 2018. Furthermore, economic data in general is decelerating in 2019. During 4th Quarter 2018, the US economy hit a record expansion of 10 consecutive quarters. It doesn’t seem possible that 1st Quarter 2019 will set another record.
We don’t think this is the end of the expansion cycle and that the US economy is now heading into a recession. However, the economy is certainly not growing at the same pace it was last year. And economies around the world are not improving.
All this to say that what the US economy is experiencing now is a deceleration of GDP. Although we believe the US market is in a secular bull market, this deceleration may or may not end up in a short-term bear market at a certain point. It’s all on the Fed’s shoulders.
Therefore, our main point remains the same one we have been advocating since the summer: remain prudently invested. By prudently we mean late economic cycle assets, solid companies and low beta.
Current Bullish Main Trends: Some of our technical indicators are getting stronger and supportive of a continuation higher for equities. As of Friday, we have confirmation of bullish main trends in defensive sectors, industrials and consumer discretionary. Additionally, the main trend of volatility is now bearish, (it moves in the opposite direction as equities).
A couple of additional facts without trying to sound too concerned: During the internet bubble in 2001, the S&P500 Index had two bear market rallies: one +22% move at the beginning of the year and a second +24% move in the 3rd Quarter 2001. As we all know now, both rallies failed and so did the +14% bear market rally in 2008 during the mortgage crisis.


You may click here to access more information about our analytical quantitative and qualitative process: “The Roots of Our Process,” which allowed us to avoid the internet bubble, subprime crisis, a brief bear market in 2011, correction in 2015 -2016 and the current correction/bear market.


