
During the last few days, the stock market had a predictable bounce from an oversold condition. The April / May selloff was quite aggressive. The S&P 500 index lost about -17.5% from its peak on March 29 to its trough on May 20. Since then, it rallied by almost 9% reaching 38% retracement of the previous down leg on light volume. The S&P 500 is also encountering overhead resistance from its March lows (blue shaded line on chart 1).
Chart 1
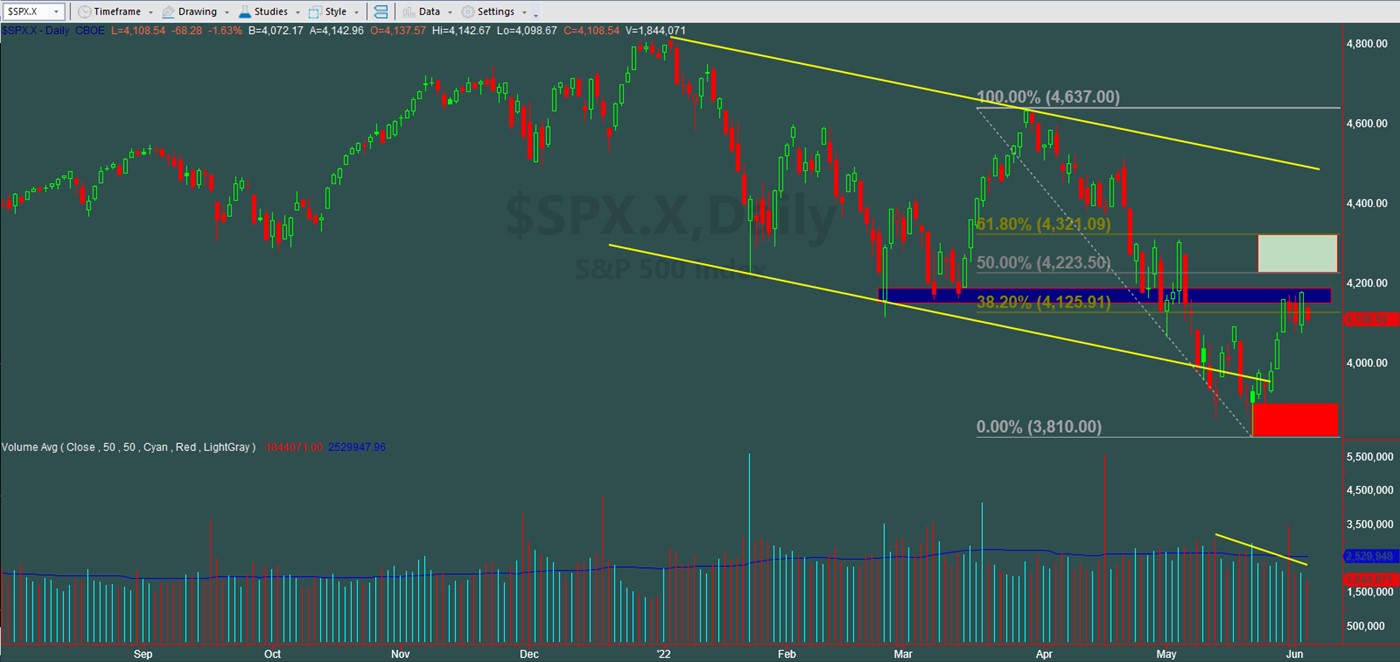
Chart provided by TradeStation
The Nasdaq’s bounce is even less impressive. It did not even make it to the 38% retracement and the advance was on light volume too (chart 2). The question is where does the S&P 500 go from here? Although we’ve seen some encouraging rotations during the last few days, it doesn’t seem to be enough to support a change in the main trend.
Chart 2
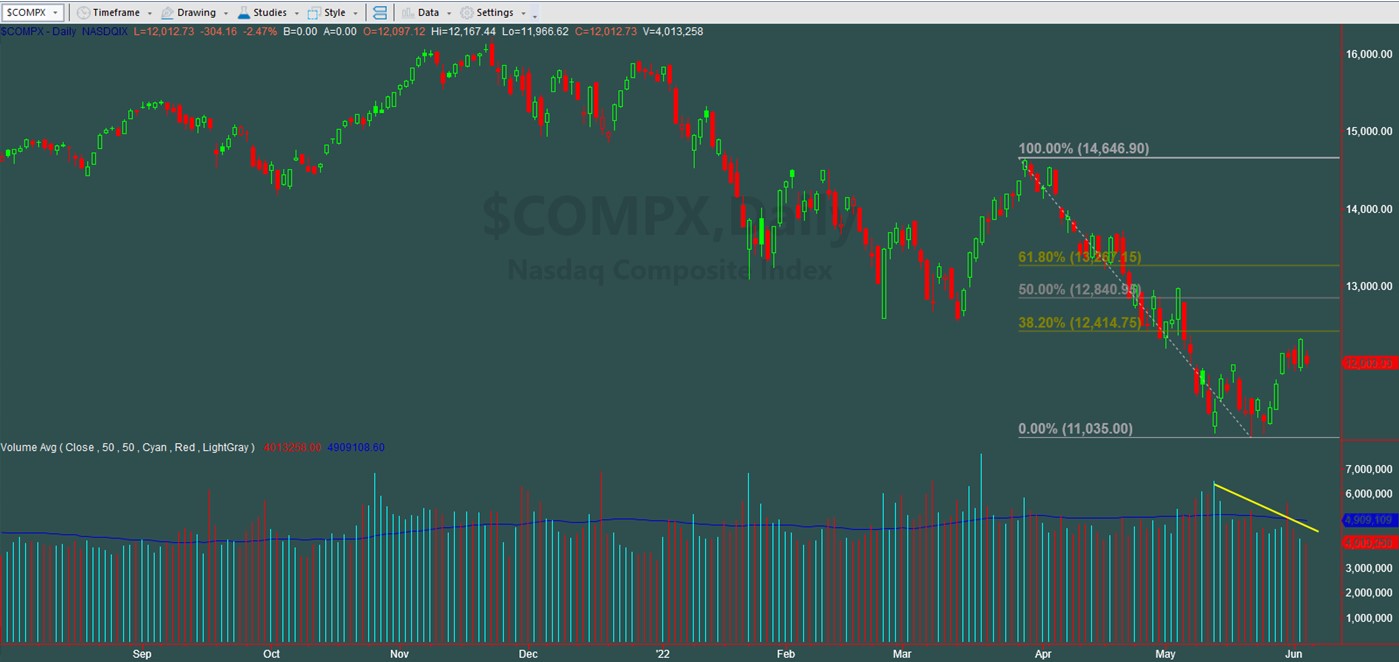
Chart provided by TradeStation
The S&P 500 Index is still in a bear market not just because it fell by -20% from its peak in December to its trough in May, but because the Main Trend of the index is down and bearish. Although the current range of the index has room for about another 3% appreciation to the 4220 / 4320 area (green shaded area on chart 1), the lower end of the range seats at 3810 (red shaded area on chart 1) which is about a -7% drop. The risk-reward ratio is not there, not even for a short-term speculative trade with volatility in the mid-20s. Nevertheless, if the S&P 500 manages to break and close above 4190 / 4200, the next range should be increased to 4220 / 4320. If a sustainable and credible breakout occurs at 4320, a reassessment of the downtrend should be made. We’ll cross that bridge when and if it gets there.
Regardless of short-term trading conditions and levels, in our opinion, it is very unlike that the Main Trend of the index goes from bearish to bullish in the current scenario. Amongst other variables:
- Our quantitative model remains bearish. Check our Index Trend Table.
- Yield spreads remain elevated mainly in high yield and junk credits. This is not good for stocks.
- The short-term bullish bounces we are seeing in the S&P 500 and Nasdaq are from oversold levels, within bigger downtrends, on low volume, and elevated volatility.
- The sector leadership during the oversold bounce has not been adequate or strong enough to turn the existing downtrend into a more sustainable uptrend.
- In a weighted cap index such as the S&P 500, there are some mega-cap companies that can turn the needle up or down. That group of companies includes AAPL, AMZN, FB, GOOGL, MSFT, NFLX, and TSLA. They are all in down-trends.
- The balance of investors’ interest between growth and value stocks remains towards value and defensive.
- The 10-year Treasury yield at 2.95% is breaking out of a descending bullish wedge and ready to challenge 3.16%, which is its May 9 high. If this trend continues, it may be an indication that inflation may prove to be more aggressive than expected. If this is the case, the downtrend for stocks should continue. Chart 3.
- Gold is resuming its uptrend, or it is not breaking down. Either way, with Treasury yields moving up, gold strength may be an indication that investors expect more risk (volatility) during the summer months and perhaps into the autumn. Gold does not perform well when interest rates move up, nonetheless it is not breaking down.
- Although employment is a lagging indicator, it is the number that the Federal Reserve (FED) looks at, and Friday’s employment report may suggest that labor demand may be cooling, but not enough for the FED to change their tightening policy. Mainly now that Janet Yellen, Secretary of the Treasury, just figured that inflation is not transitory.
- Energy, currently the main contributor to inflation, remains in an uptrend.
Chart 3
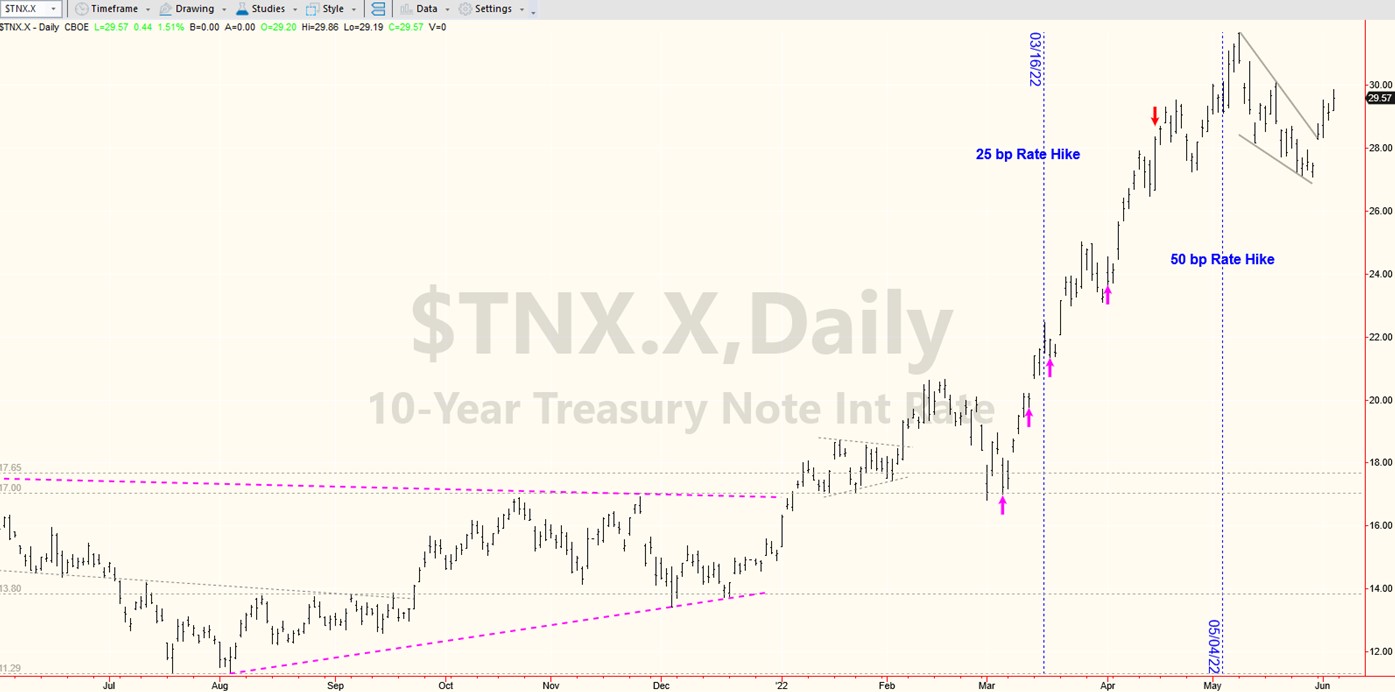
Chart provided by TradeStation
Just to have a better understanding of how economic recessions start, we researched all recessions in the U.S. since 1970. All of them started with a combination of high energy prices, lower bond prices, and higher interest rates to control it, which eventually reduced future earnings and consumer spending. Consequently, companies lost the appetite for new investments, which caused a slowdown in global growth. The final result is always an economic recession with the exception of Black Monday in 1987. It started in the same exact way, produced a sharp selloff in the stock market but did not end up in a recession. Does it sound familiar?
Conclusion: we started to build a defensive portfolio positioning back in January. We remain prudent and our current asset allocation reveals our intention to continue protecting capital and avoiding taking risks until signals of a credible and sustainable bounce given by our quantitative model arise. For the time being, a new leg in the stock market is evolving and the bulk of the evidence points that it could be a leg down. Remember that investing is a game of probabilities. Anything is possible, but is it probable? Therefore, the question should never be whether or not it is possible, but whether or not it is probable to happen. Is it possible that the stock market rallies from here? Of course, it is, but is it probable given certain variables and conditions present in the stock market?
With best wishes,
Saul A. Padilla, RIA
Portfolio Manager
(*) The Greenwich Creek Capital “Index Trend Table” is not meant to be used in isolation, it is part of a more complex set of variables and it is not designed to provide trade entry and exit points.
Do you have a risk management strategy and a proven repetitive investment process to profit in bull markets and protect capital in bear markets? Check our website for more information about how we manage investment portfolios:
www.GreenwichCreekCapital.com
For High Net Worth Portfolios
And
www.FreedomInvest.com
The Active Asset Management Platform for Small Accounts.


