
The S&P 500 Index broke above 3000, but what if 3000 doesn’t hold? The index closed at 3044.31 on Friday 29th.
Managing risk in a well synchronized bull market, when everything moves up, is not that difficult. But how do you manage risk in a bear market rally, if in fact the S&P 500 is in a bear market? Or when the main trend of the S&P 500 is bearish and the main trend of the Nasdaq is bullish? How do you know if the recent 3000 breakout of the S&P 500 is reliable?
To figure it out, we start by determining market trends in different time frames: Short Term (1 to 4 weeks), Mid-Term (5 to 12 weeks) and Long Term (4 to 9 months). But there is one more trend we call the Main Trend. Very simply put, it is like walking from one end of the block to the other end of the block. Short Term is like zig zagging on the sidewalk towards the other end of the block. Mid-Term would be walking in the same direction than prior but now instead of just walking on the sidewalk, your zig zagging goes from the sidewalk to the center line of the street. You are still walking in the same direction, but the zig zags are longer. Long Term would be walking in the same direction, but now the zig zagging goes from one sidewalk and across the street to the other sidewalk, back and forth. The Main Trend is always the same: from one end of the block to the other end of it, but the deviations are longer. In terms of financial markets, the greater the zig zags, the greater the risk.
In well-defined bull and bear markets, when the Main Trends of the S&P500, Nasdaq, Mid Cap and Small Cap are all in the same direction, making risk management decisions is easier. However, when the indexes are not all aligned in the same direction, like now, taking on more risk or buying a pullback in a presumably bull market becomes a much more difficult decision.
Currently the Short, Mid, Long and Main Trends of the Nasdaq are bullish. But the Main Trends of the S&P 500 Index, S&P 400 Mid Cap and Russell 2000 Small Cap remain bearish. If the market conditions continue to improve, the Main Trend of the S&P 500 may be able to change from bearish to bullish because the Short, Mid and Long Term Trends are already bullish. If the Nasdaq and the S&P 500 were aligned in the same direction, buying a pullback would be an easy decision. The table below called “Market Trends” is the result of our analysis to define the trends of various indexes, commodities, treasury yield, currencies, sectors and even stocks in different time frames and within our repetitive investment process. The Market Trend table will be available on our website shortly.
In practical terms, the chart below shows the S&P 500 Index at the closing of Friday 29th with a significant improvement in volume, which is positive. Volatility remains high (VIX at 27.51). In our opinion, bull markets require substantially lower volatility, usually no higher than mid-teens.
The stock market is currently overbought and Friday’s increase in volume was probably linked to speculators being net short. The only way to close a short position is by buying it back. Thus, if we are correct, all those short sellers became buyers to close their short positions, most likely at a loss, on increasing volume. Now the overbought stock market may be due for some profit taking.
I wrote in my previous article that “technology, health care and communication services are in uptrends. These three sectors represent 51.9% of the S&P500 index.” True, but then 48.1% of the index is not in an uptrend, which can be a drag. Additionally, there is uncertainty in terms of how the new economy will eventually look like.
Defining the technical levels of the S&P 500 Index:
Short term trading range: 2920 to 3070 (Gray box in the cart below)
First area of support: 3000 (Yellow dotted line)
Next area of support: 2920
If 2920 area of support does not hold due to a strong selloff or profit taking, there are two more areas of support that should hold for the short term uptrend to remain in place. Those two areas are 2860/2850 (blue box) and 2760/2720 (bottom pink line). If the index gets to make a test of 2760/2720 support, in our opinion, that support area must hold for the index to have another chance at challenging 3000.
Although the Nasdaq and S&P 500 are not bullishly aligned, keep in mind that the FED and the Treasury Dept. are doing absolutely everything at their reach to support the economy. By doing it, they are also helping financial markets. This action should not be taken as a guarantee that the S&P 500, S&P 400 Mid Cap and Russell 2000 Small Cap will resume their uptrends. The market will determine the final outcome. By the same token, financial markets will determine when the excesses of government policies to support economies will hit the world with the next crisis. This is why it is of utmost importance to listen to what financial markets are telling us. The only way to do it, is to have a repetitive, reliable and proven investment process.
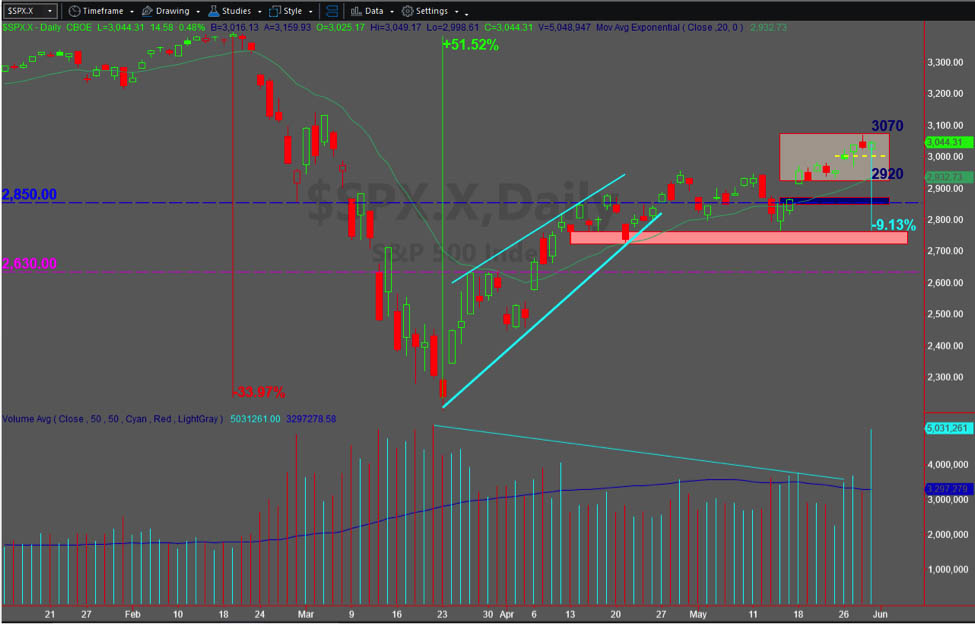
Chart provided by TradeStation
Do you have a risk management strategy and a proven repetitive investment process to profit in bull markets and protect capital in bear markets? Check our website for more information about how we manage investment portfolios:
For High Net Worth Portfolios & The Active Asset Management Platform for Small Accounts
Saul A. Padilla, RIA
Portfolio Manager


